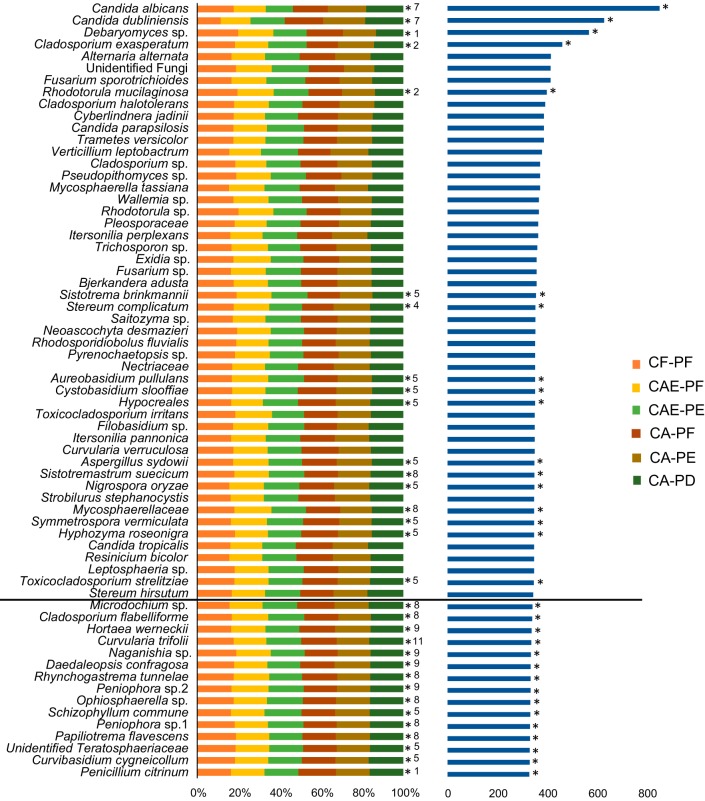
FIG 4.
Distribution of the top 50 most abundant taxa across the six plaque categories using variance-stabilizing transformation of taxon counts. The left chart shows the mean taxon counts for each plaque category. All taxa below the bold line were not present in the top 50 most abundant taxa but were statistically significantly differentially abundant. The chart on the right depicts the sum total of the counts for each taxon. *, taxa whose frequency was significantly different among the plaque categories (determined using DESeq2 and adjusted for multiple comparisons using Benjamini and Hochberg multiple testing adjustment).

