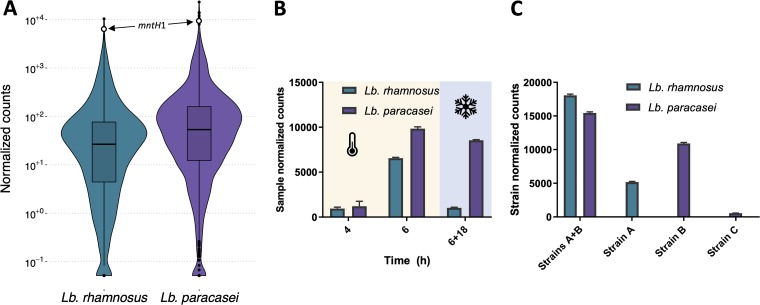
FIG 4.
Overall and mntH1-specific gene count distribution. (A) Sample-normalized gene count distribution of BioP L. rhamnosus and L. paracasei during coculture after 6 h milk fermentation. A white circle denotes the mntH1 count level. (B) Temporal, sample-normalized mntH1 count levels of BioP strains during 37°C milk fermentation (4 h, 6 h), and after 6 h of 37°C milk fermentation and 18 h of 7°C storage (6 + 18 h). (C) Normalized mntH1 count levels after 6 h of coculture (strains A and B) and individual culture (strain A, strain B, and strain C) in milk. Normalization is here performed individually for each strain, also for coculture. Included are the BioP strains (strains A and B) and an L. paracasei strain with a lower level of bioprotective activity (strain C).

