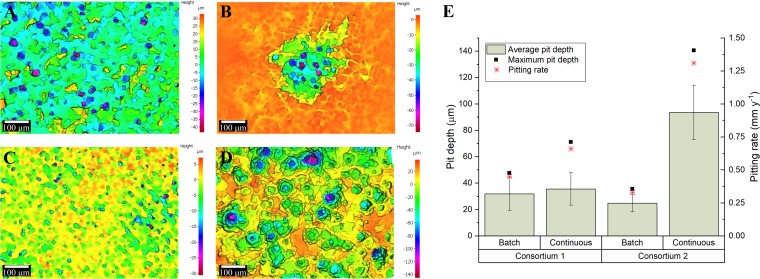
FIG 6.
Localized corrosion analysis of carbon steel coupons exposed to different nutrient conditions. (A to D) 3D optical microscope surface images of carbon steel coupons. (A) Consortium 1 under batch conditions; (B) consortium 1 with continuous replenishment; (C) consortium 2 under batch conditions; (D) consortium 2 with continuous replenishment. (E) Average pit depths and pitting rates calculated from the maximum pit depth. Error bars represent standard deviations of the 10 deepest pits found in three independent replicates.

