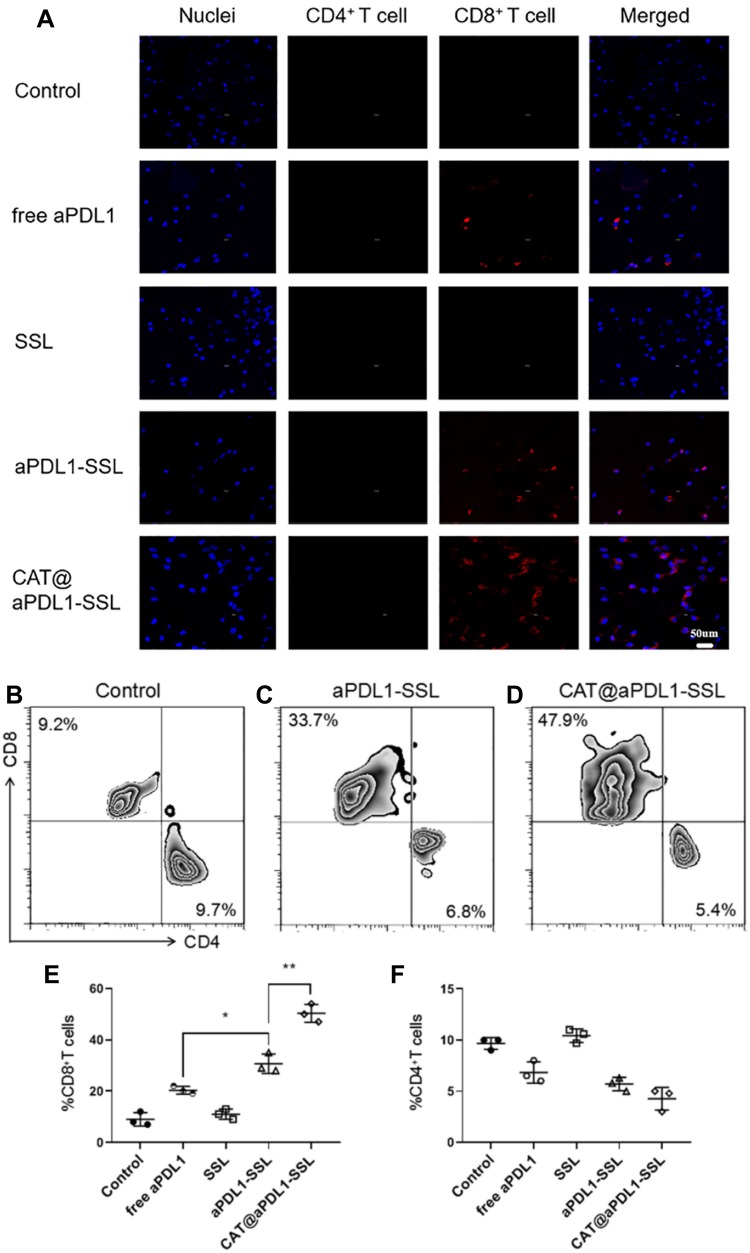
Figure 7.
Immunofluorescence of tumor slices and flow cytometry analysis showing CD4+ and CD8+ T cell infiltration.
Notes: (A) Immunofluorescence of tumor slices.The blue signals represent nuclei stained with DAPI. The green signals represent CD4+ T cells stained with AF488-CD4+ antibodies and the red signals represent CD8+ T cells stained with AF647-CD8+ antibodies. (Scale bar: 50 μm). (B, C and D) Flow cytometry analysis and (E and F) their corresponding percentage of CD8+ and CD4+ tumor infiltrating T cells (n = 3, results are means ± S.D.,*P < 0.05,**P < 0.01).
Abbreviations: aPDL1, programmed death ligand 1 monoclonal antibody; CAT, catalase; SSL, sterically stabilized liposome; aPDL1-SSLs, aPDL1 modified immunoliposomes; CAT@aPDL1-SSLs, CAT-loaded immunoliposomes.

