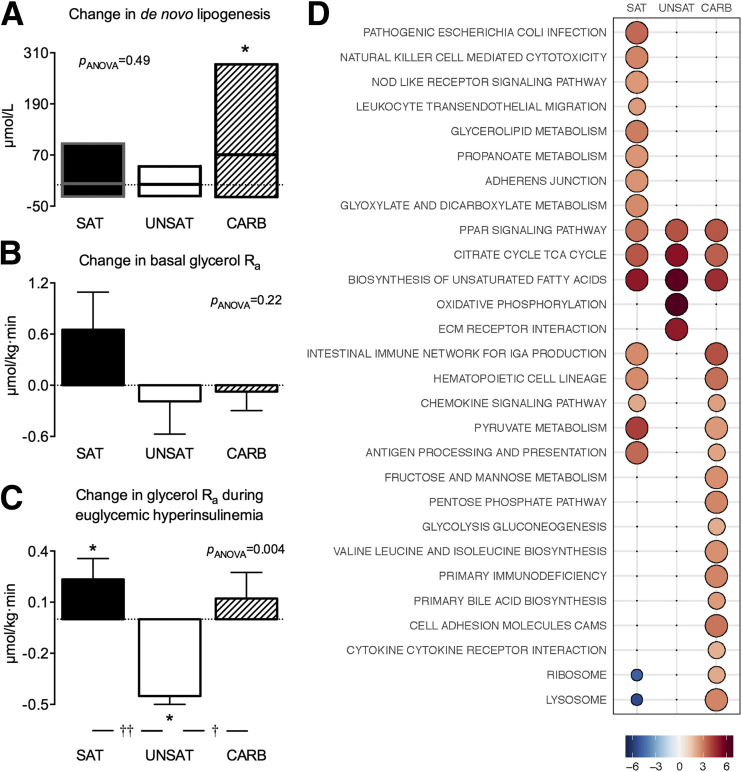
Figure 2.
Overfeeding-induced changes in hepatic de novo lipogenesis (A), basal glycerol Ra (B), and glycerol Ra (C) during euglycemic hyperinsulinemia. The y-axes indicate the change of mean values after vs. before overfeeding within groups. Data are shown as medians (interquartile ranges) in panel A and as mean ± SEM in B and C. *P < 0.05 within group; †P < 0.05 and ††P < 0.01 between groups. D: Adipose tissue transcriptome. The bubble grid shows the reporter test statistics (proportional to size and color intensity) of relative gene expression after compared with before overfeeding. Only pathways significant in at least one diet are shown (<5% false discovery rate).

