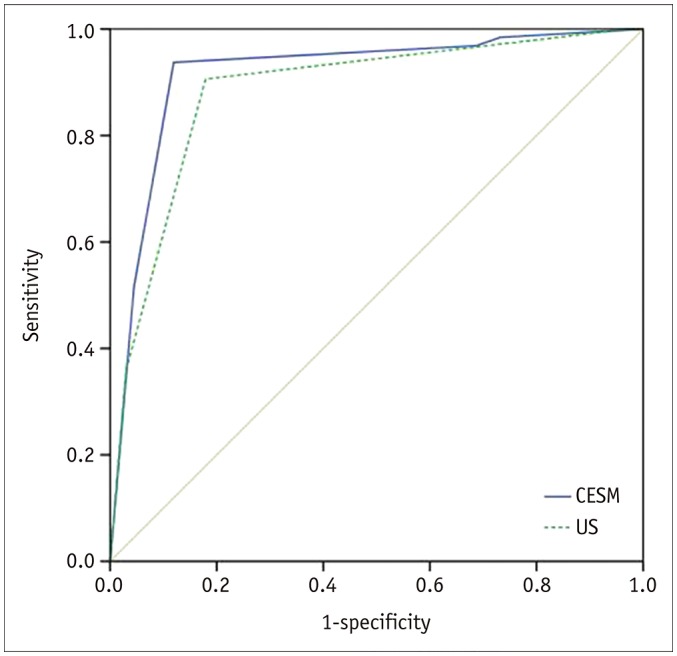
Fig. 2. Receiver operating characteristic curves to illustrate diagnostic performances of CESM and US.

AUC for CESM in diagnosis of breast lesions was 0.917 (95% CI, 0.863–0.970). AUC for US in diagnosis of breast lesions was 0.884 (95% CI, 0.823–0.944). Difference of AUC between CESM and US was not significant (p = 0.225). AUC = area under curve, CI = confidence interval
