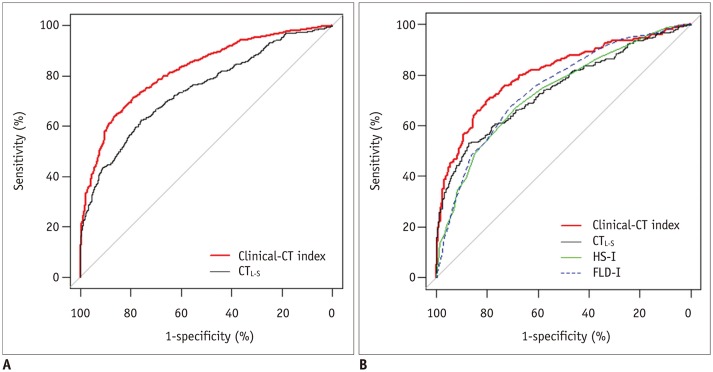
Fig. 3. Receiver operating characteristic curves of performance of clinical-CT index in diagnosing non-alcoholic fatty liver disease, compared with CTL-S in development cohort (A) and compared with CTL-S, HS-I, and FLD-I in test cohort (B).
CTL-S = mean liver attenuation - mean spleen attenuation on non-enhanced CT, FLD-I = fatty liver disease index, HS-I = hepatic steatosis index

