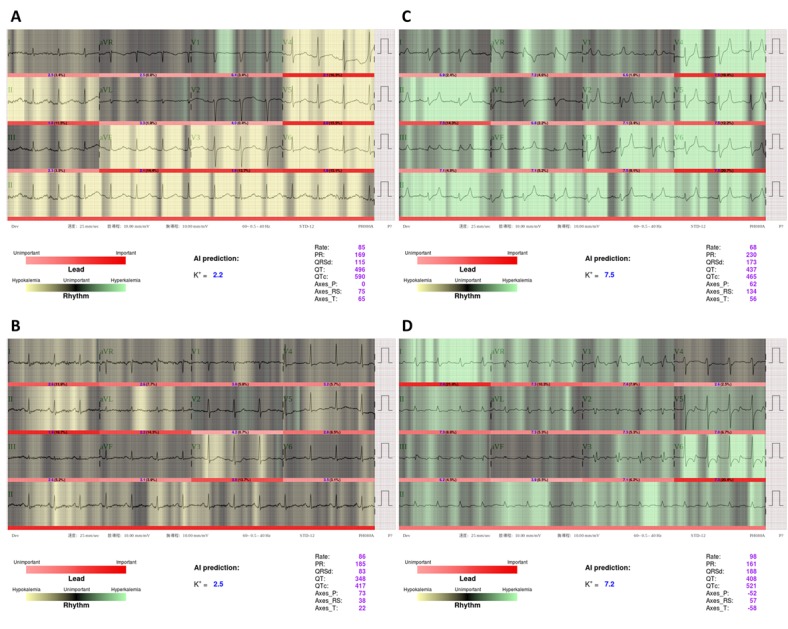
Figure 4.

Visualization analysis for ECG12Net-1 in selected severe hypokalemia and hyperkalemia cases. The lighter areas (green or yellow) indicate areas of focus by ECG12Net-1. Clinicians consistently recognized panel A as a typical case of severe hypokalemia but overlooked panel B. Similarly, clinicians consistently recognized panel C as severe hyperkalemia but overlooked panel D. From A to D, the real K+ concentrations were 2.3 mEq/L, 2.5 mEq/L, 9.1 mEq/L, and 7.1 mEq/L, respectively. AI: artificial intelligence.
