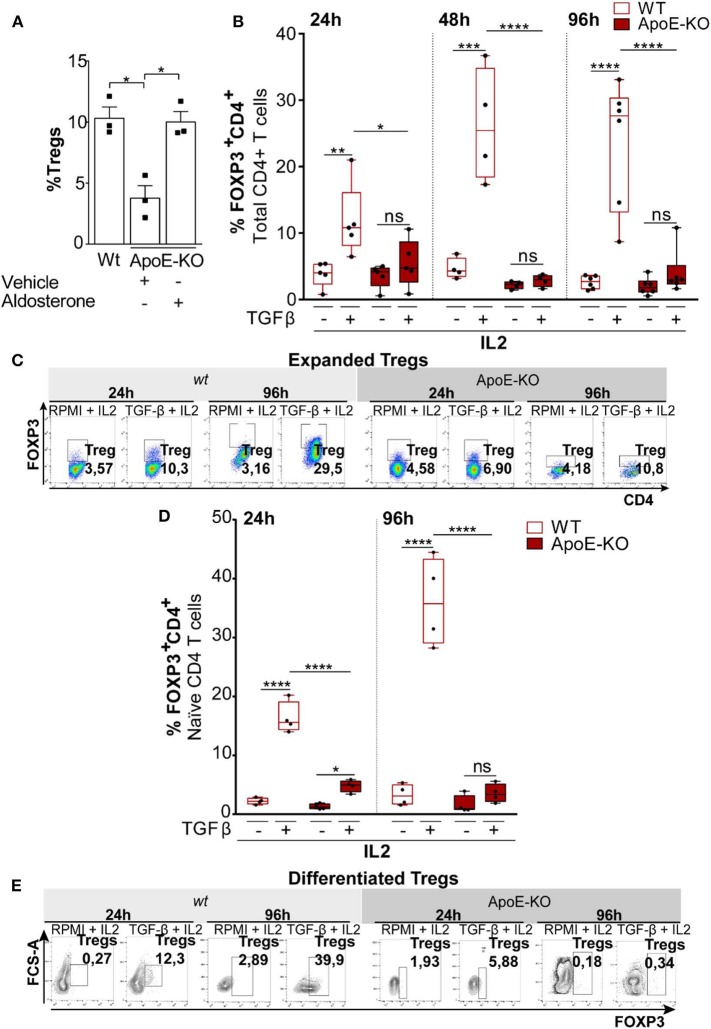
Figure 3.
(A) Percentage of Tregs (FOXP3+CD4+) in splenocytes obtained from wt (n = 3), ApoE-KO (n = 3), and ApoE-KO + aldosterone (n = 3). (B) Expanded Tregs treated with TGFβ (2 ng/ml) and IL2 (100 U/ml) in wt (n = 5) and ApoE-KO mice (n = 5) started from CD4+ T cell. The histograms represent % of Tregs (CD4+FOXP3+) analyzed by flow cytometry. The experiments were conducted at different times, 24, 48, and 96 h, by culturing CD4+ T cells isolated from spleens of wild type (wt) mice and ApoE-KO mice, in the presence of IL2, treated or not with TGFβ and stimulated with plate-bound anti-CD3 and anti-CD28. (C) Representative dot plots of expanded Tregs from five independent experiments in wt and ApoE-KO mice. (D) Differentiated Tregs with TGFβ (2 ng/ml) and IL2 (100 U/ml) in wt (n = 4) and ApoE-KO mice (n = 4). The bar graph indicates % of Tregs (CD4+FOXP3+) at two different times, 24 and 96 h, by culturing naïve CD4+ T cells isolated from spleens of wt mice and ApoE-KO mice, in the presence of IL2, treated or not with TGFβ and stimulated with plate-bound anti-CD3 and anti-CD28. (E) Representative dot plots of differentiated Tregs from four independent experiments. *P < 0.05, **P < 0.01, ***P < 0.001, ****P < 0.0001, by two-way analysis of variance (ANOVA).

