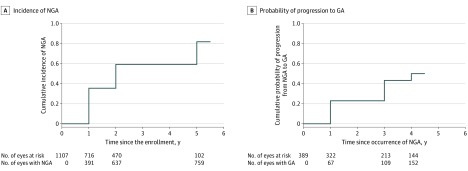
Figure 2. Kaplan-Meier Curves for the Incidence of Nongeographic Atrophy and Probability of Progression From Nongeographic Atrophy (NGA) to Geographic Atrophy (GA).
A, Kaplan-Meier curve for the cumulative incidence of NGA. B, Kaplan-Meier curve for the cumulative probability of progression from to geographic atrophy.

