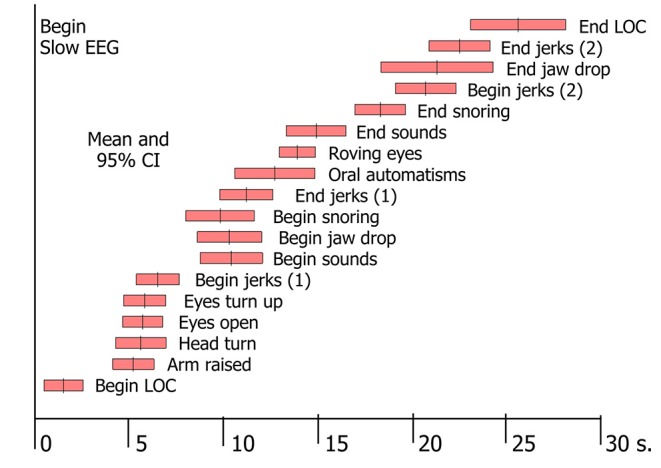
Figure 2.

Signs in tilt-induced VVS. Each bar represents the mean value and the 95% confidence intervals for a range of signs, determined by analysis of video-EEG records of 69 cases of tilt-induced VVS [These data conform to Table 2 in Van Dijk et al. (3)].
