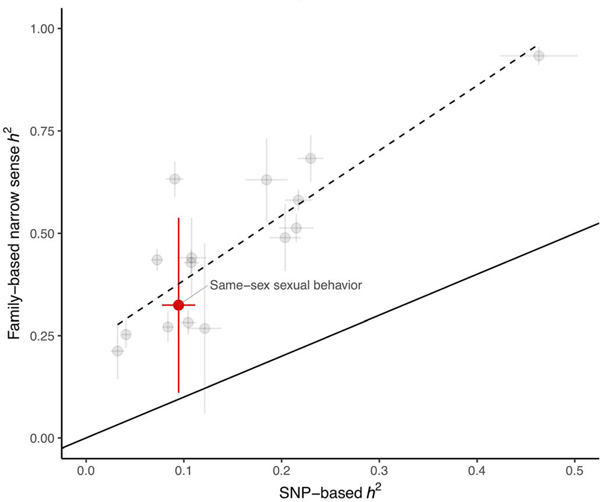
Fig. 3. SNP-based versus family-based heritability estimates for same-sex sexual behavior compared with a variety of other traits.
Heritability, h2; same-sex sexual behavior, red dot; other traits, gray dots. The estimates for all traits are provided in table S23. Horizontal bars represent 95% CIs for the SNP-based estimate, and vertical bars represent 95% CIs for the family-based estimate. Dashed and solid lines represent the observed (obtained by linear regression) and expected relationship between family-based and SNP-based heritability, respectively.

