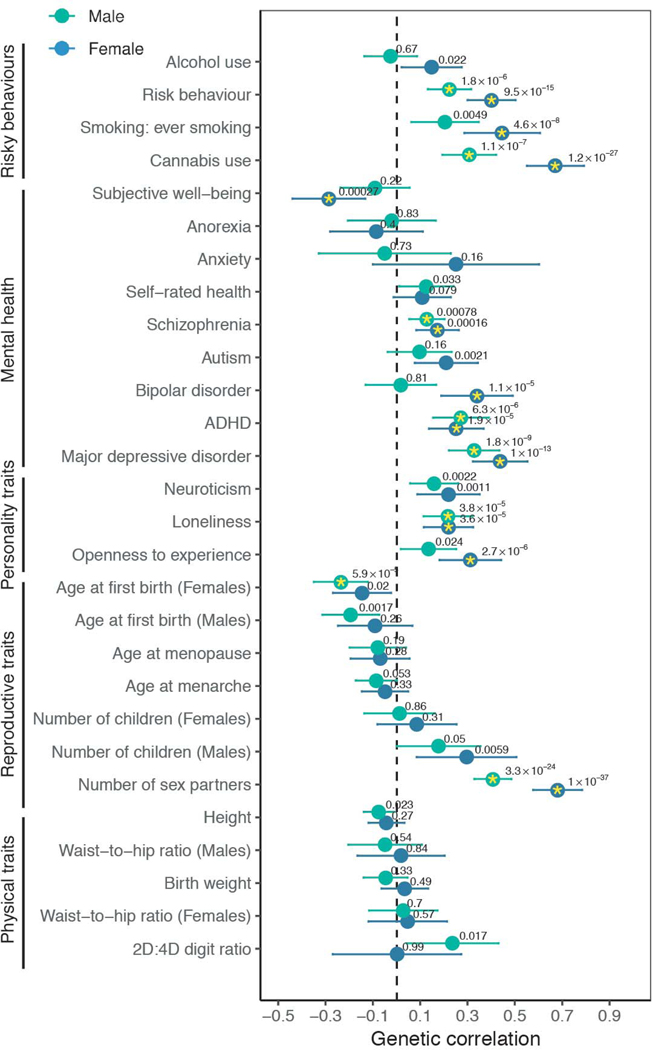
Fig. 4. Genetic correlations of same-sex sexual behavior with various preselected traits and disorders, separately for males and females.
Males, green; females, blue. Yellow asterisks denote the genetic correlations that were experiment-wise significant (P < 8.9 × 10⁻⁴; references, definitions, and full results can be found in table S19). Wald test P values for the genetic correlations are reported above each dot. Horizontal bars represent 95% CIs.

