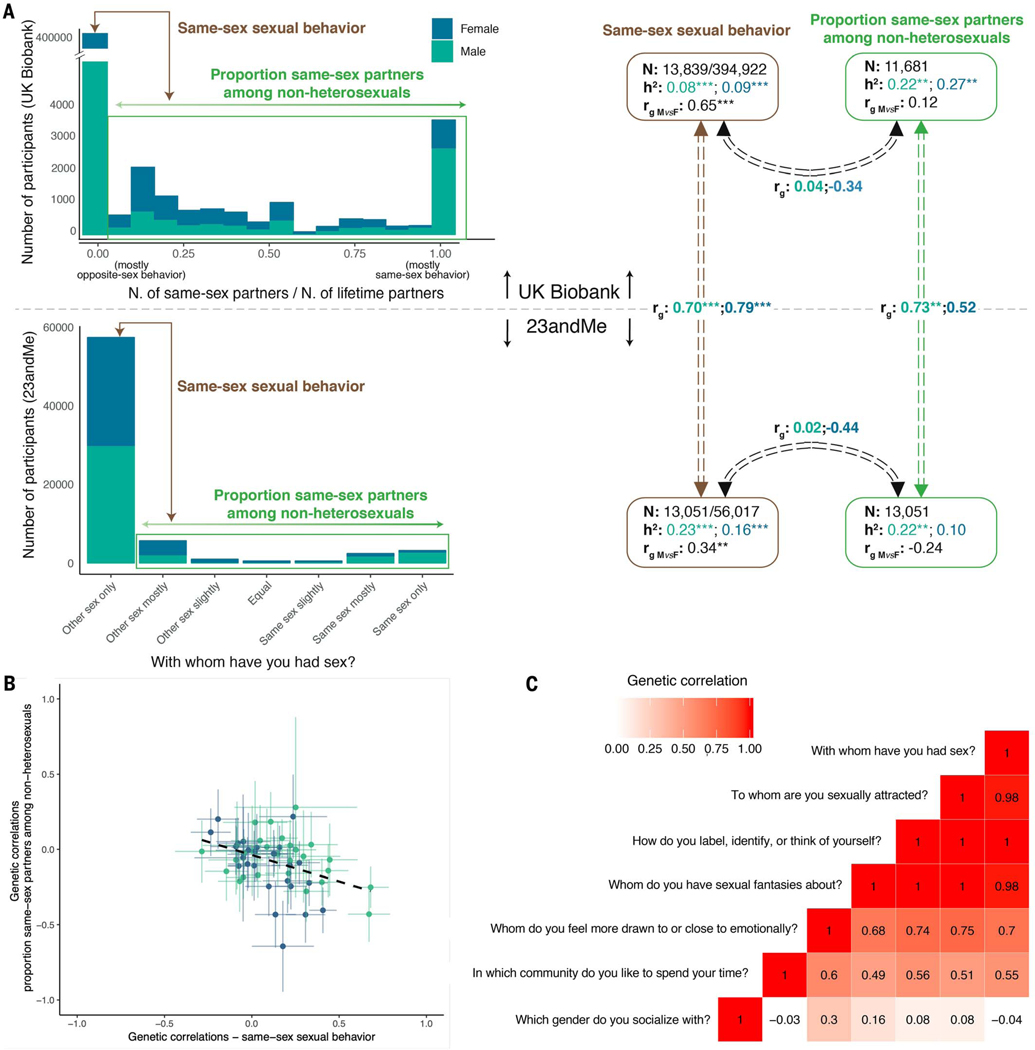
Fig. 5. Complexity and heterogeneity of genetic influences.
(A)Genetic correlations between the main phenotype (same-sex sexual behavior; heterosexuals versus nonheterosexuals) and proportion of same-sex to total sexual partners among nonheterosexuals, in the UK Biobank and 23andMe samples. (B) Scatterplot showing genetic correlations of the main phenotype (x axis) and the proportion of same-sex to total partners among nonheterosexuals (y axis) with various other traits (table S21). (C) Genetic correlations among different sexual preference items in the 23andMe sample.

