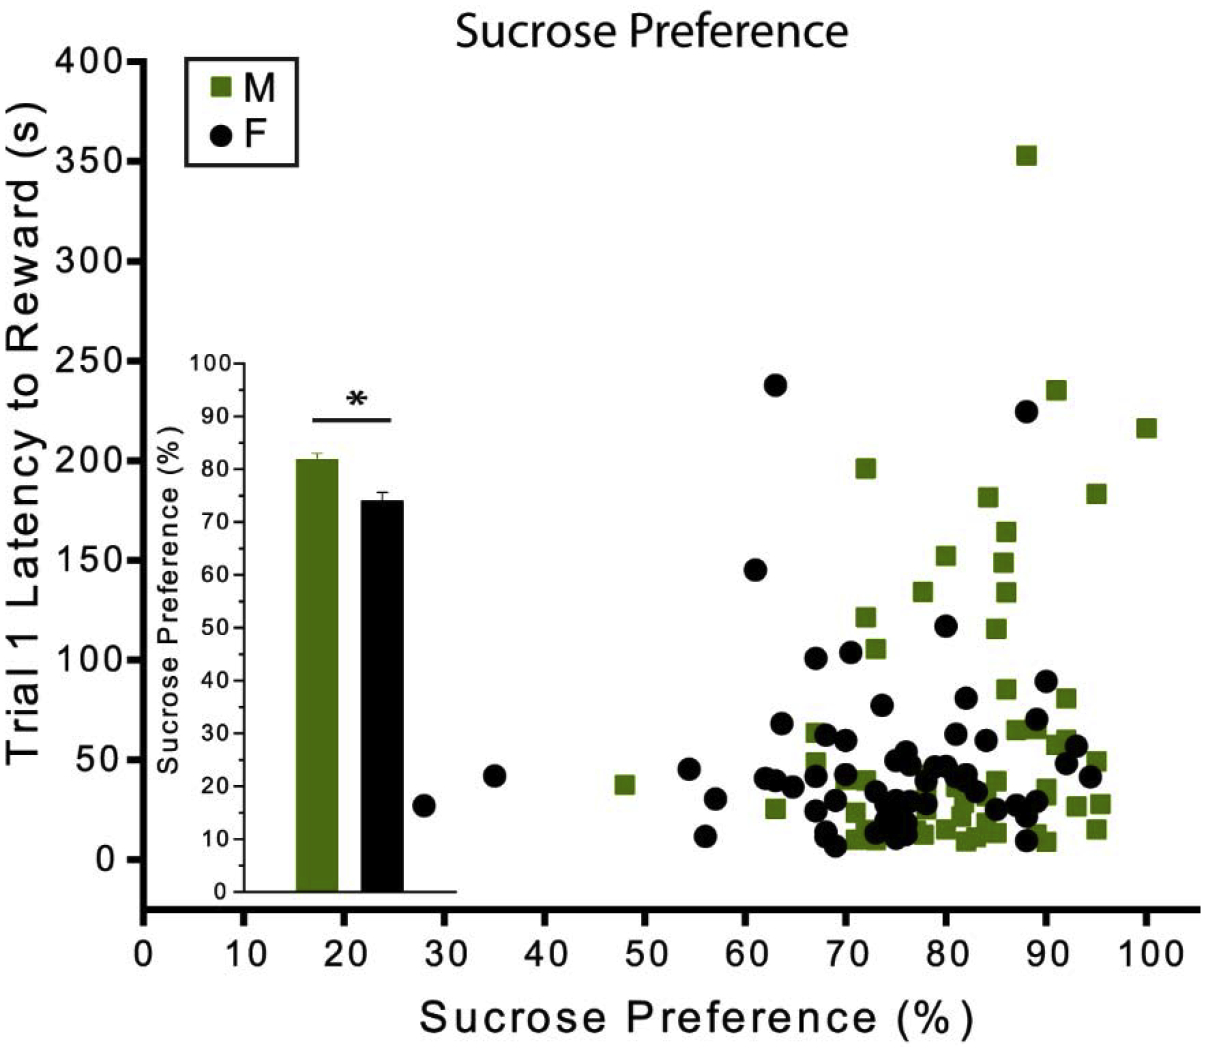
Fig. 5. Sucrose preference and latency to reward.

Correlation between sucrose preference and latency to reward in the first trial. The bar graph inset reflects the difference in the mean sucrose preference scores between males and females. There was no significant correlation between sucrose preference and latency to retrieve the reward across individual mice [r = 0.14, p = 0.13]. Females exhibited a slightly but significantly weaker preference for sucrose over water than males [t(115) = 3.82, p = 0.00]. Error bars show mean ± SEM. CB: n = 41 (19 males); MV: n = 36 (20 males); PEA: n = 40 (19 males). Asterisk indicates P < 0.01. CB, clean bedding; MV, methyl valerate; PEA, phenylethylamine; M, male; F, female.
