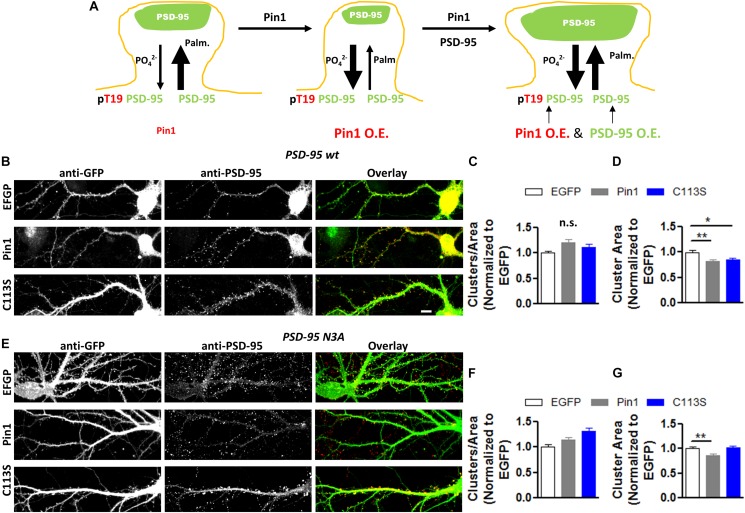
FIGURE 8.
PSD-95 restores the decrease in PSD-95 cluster number induced by Pin1. (A) Model showing how post-translational modification regulates PSD-95 entry and stability at the PSD. (B) Confocal images of hippocampal cultured neurons overexpressing PSD-95 and control or Pin1 IRES EGFP. Images show EGFP, PSD-95 staining and the overlay image. Scale bar: 10 μm. (C) wt PSD-95 restores the decrease in cluster number. Normalized number of clusters for dendrites expressing EGFP EGFP 1.00 ± 0.04, n = 49; Pin1 1.21 ± 0.07, n = 53; C113S 1.12 ± 0.07, n = 54, (D) PSD-95 overexpression restores the area of PSD-95 clusters well above the level of non-transfected. EGFP 1.00 ± 0.04, n = 49; Pin1 0.82 ± 0.04, n = 53, C113S 0.85 ± 0.03, n = 55 Kruskal–Wallis chi-square = 13.46, df = 2, p < 0.0012. (E) Similar to wt PSD-95, overexpression of the N3A mutant of PSD-95 also restores to control levels the density of PSD-95 per dendritic area in cells overexpressing Pin1. (F) N3A overexpression restores the cluster of PSD-95 per dendritic area above the level of EGFP expressing cells. EGFP 1.00 ± 0.04, n = 42; Pin1 0.14 ± 0.05, n = 66; C113S 1.32 ± 0.06, n = 51, One-way ANOVA F(2,156) = 7.84, p = 0.0006. (G) N3A overexpression restores the area of PSD-95 clusters well above the level of non-transfected. EGFP 1.00 ± 0.03, n = 42; Pin1 0.86 ± 0.03, n = 66; C113S 1.02 ± 0.04, n = 51 55 Kruskal–Wallis chi-square = 16.21, df = 2, p < 0.0003.

