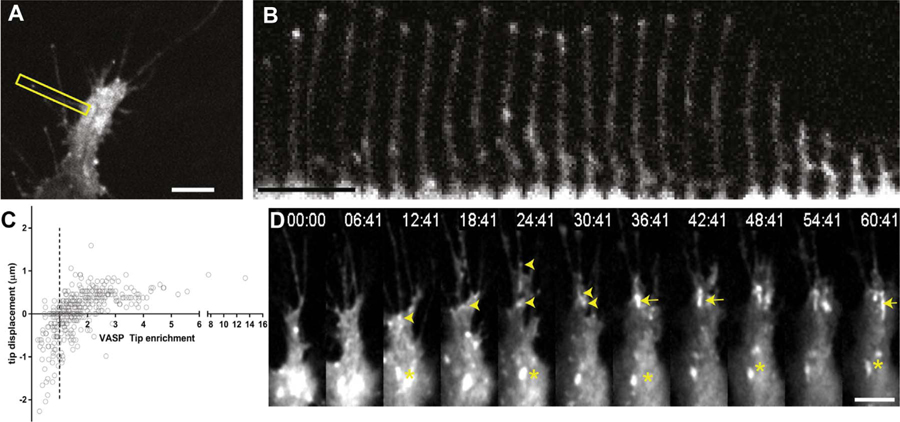
Fig. 2.
GFP-VASP highlights growing filopodia during ISV sprouting in zebrafish. (A) cropped single time point frame of GFP-VASP expressing tip cell with an example filopodium outlined in yellow box. (B) Time-lapse montage of outlined filopodium from (A); total time elapsed in series is 345 s (C) Quantification of filopodia extension as a function of GFP-VASP enrichment at the tip. The mean intensity of GFP-VASP as a ratio to the stalk intensity was quantified over time, and the tip displacement displayed such that positive values indicate extension distance over 30 s, negative values indicate retraction. Dashed vertical line shows tip:stalk intensity ratio of 1. Data shown for 22 individual filopodia. (D) Time-lapse series showing accumulation of GFP-VASP into stable, elongated focal adhesion-like structures at the base of filopodia. Puncta of VASP travel down filopodia, and stabilize at the base of the filopodium (arrowheads). Puncta can accumulate to form large fibrillar plaques (arrows) which are stable over many minutes during advance of the leading edge of the tip cell. Over time, stable plaques accumulate, and eventually begin to disassemble (asterisks), enabling forward progress of the tip cell.

