
Figure 4.
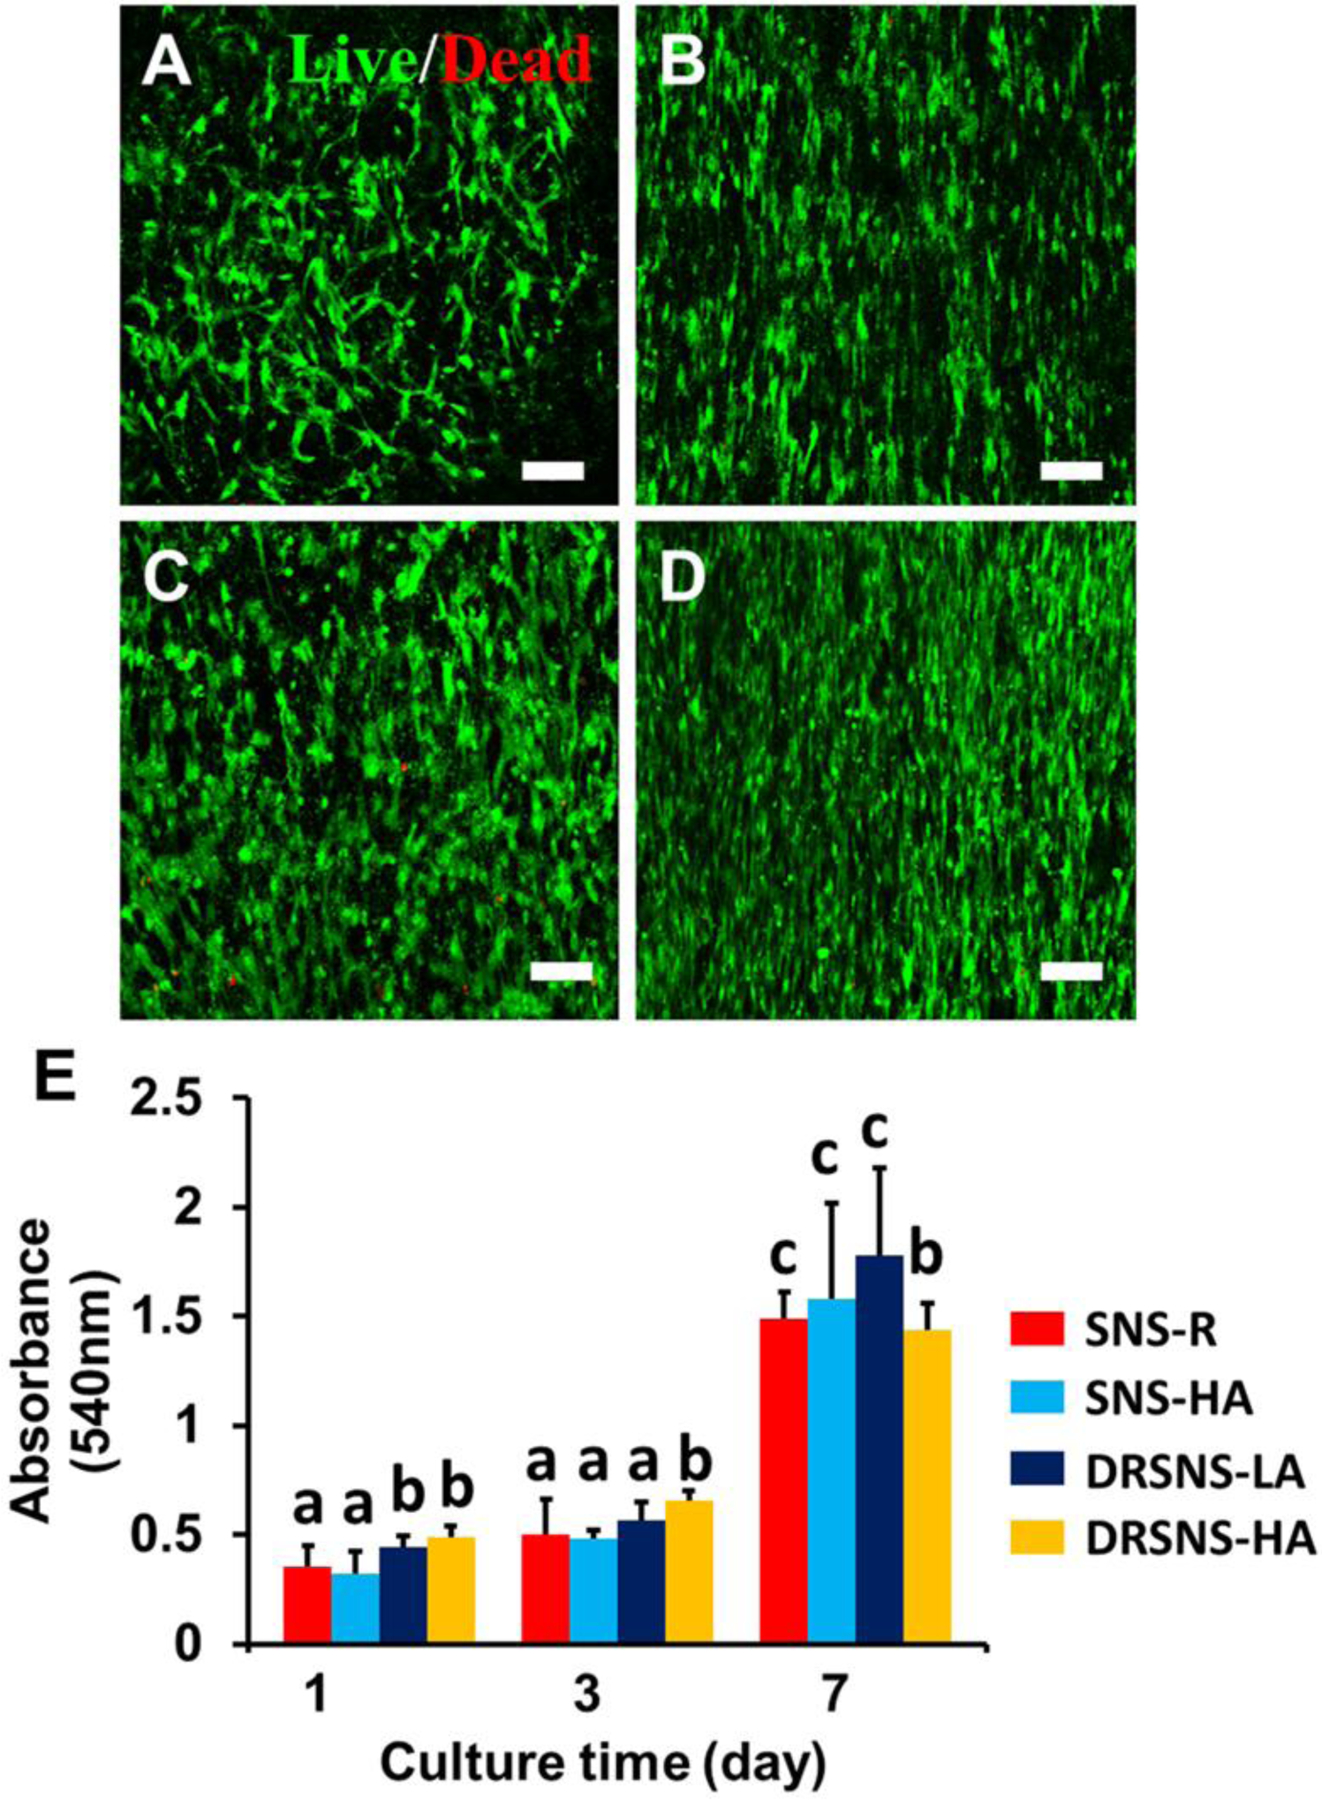
HADMSC viability and proliferation on the four different PLLA meshes fabricated by SNS- and DRSNS-based setups. Live/Dead images of HADMSCs seeded on (A) SNS-R, (B) SNS-HA, (C) DRSNS-LA and (D) DRSNS-HA after 7 days of culture. Scale bar=100 μm. (E) Cell proliferation measured by MTT assay at days 1, 3 and 7 on the four different PLLA meshes populated with HADMSCs (n=6; bars that do not share letters are significantly different from each other; *p < 0.05, **p < 0.01).