FIGURE 5.

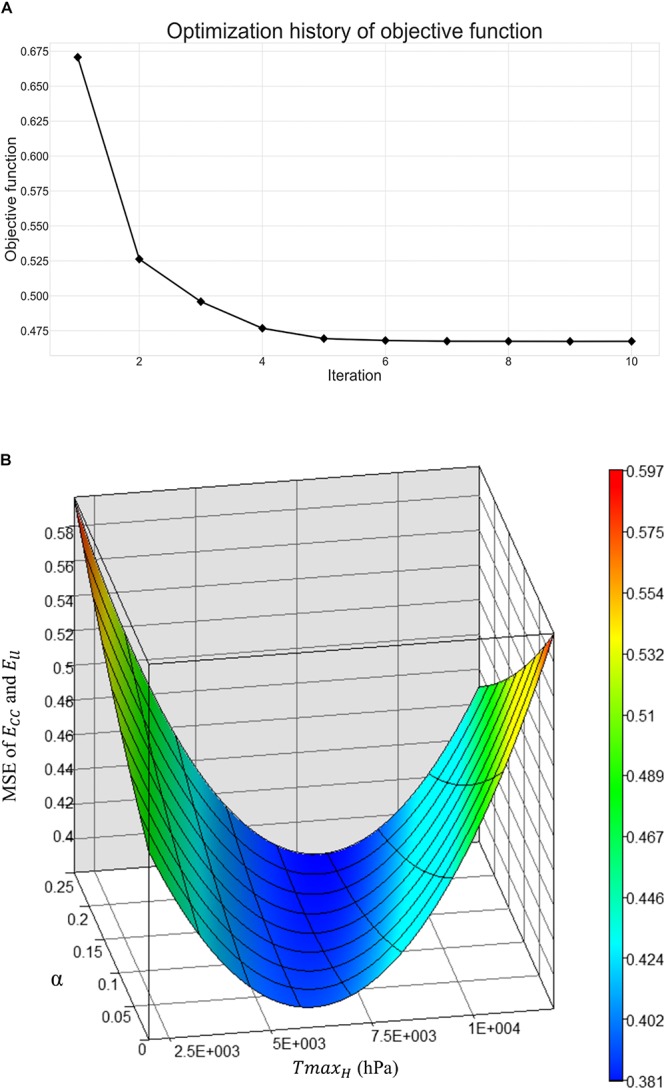
(A) Optimization history of the overall objective function, and (B) surface plot of mean-squared-error of strain with respect to TmaxH and α.

(A) Optimization history of the overall objective function, and (B) surface plot of mean-squared-error of strain with respect to TmaxH and α.