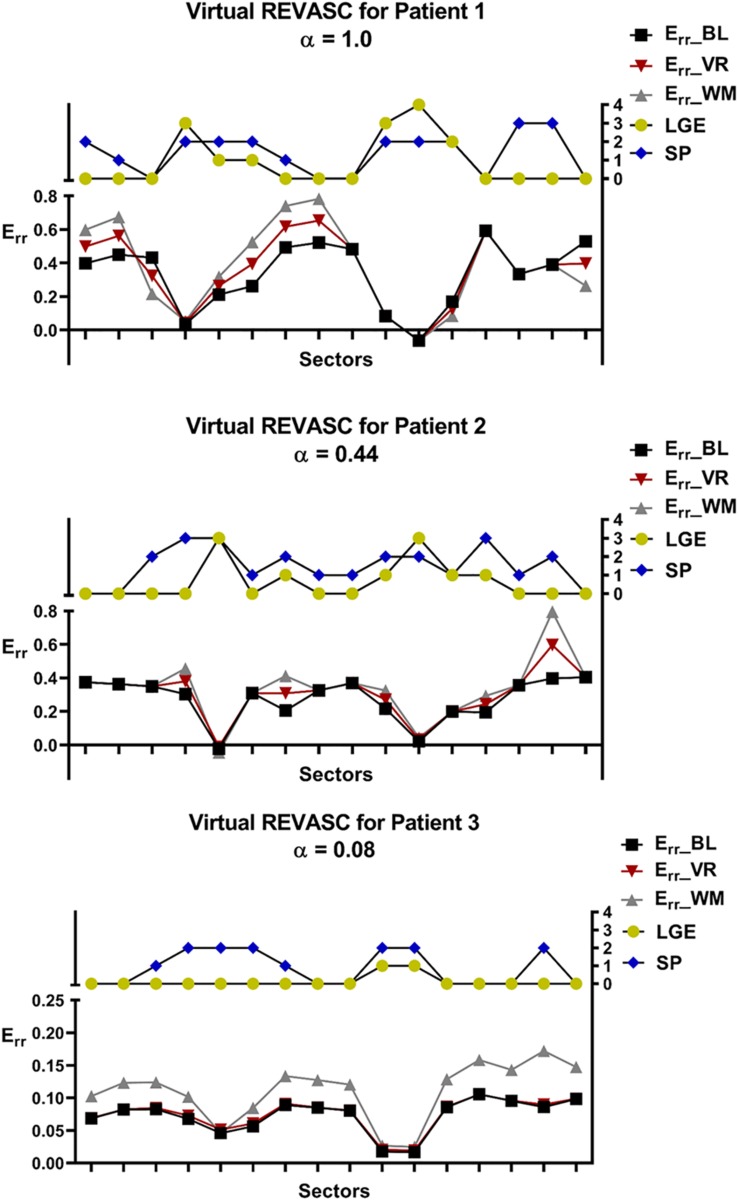
FIGURE 8.
Comparison of the sector specific Err before and after virtual REVASC for the 3 patients with positive ischemia effect, α. Sector specific MI/fibrosis (LGE) and stress perfusion (SP) scores are plotted for reference. Err BL represents Err calculated using the FE simulations at baseline, Err VR is the Err obtained from the FE simulations after virtual REVASC, and Err WM is an “actual” Err effect estimated using the qualitative wall thickening scores.

