Figure 5.

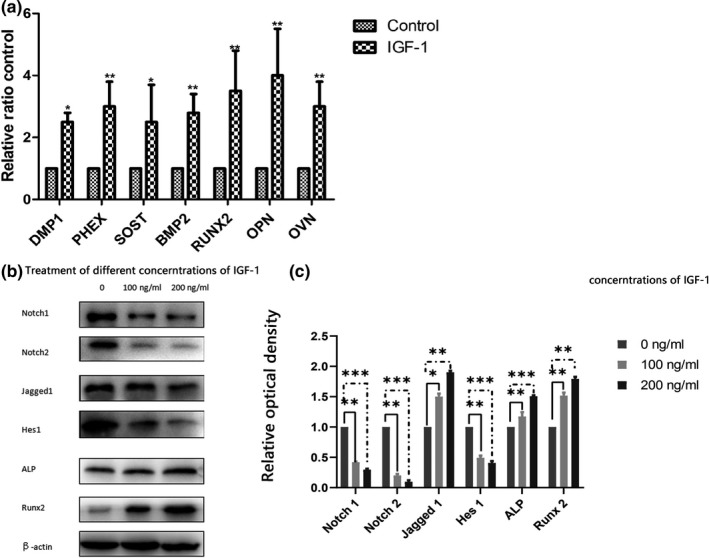
qRT‐PCR analysis and western blot analysis. (a) Gene expressions by qRT‐PCR analysis. Data are expressed as means ± SD from three biological repeats and three technical repeats. Compared with the control group, the expression of DMP1, PHEX, SOST, BMP2, RUNX2, OPN, and OCN increased significantly. (b) Western blot analysis of the effect of IGF‐1 on the expression of Notch signaling pathway‐related protein. (c) The density of each band was quantified with ImageJ. Our data showed that IGF‐1 downregulated the expression and activation of Notch1, Notch2, and Hes1. In contrast, the expression of Jagged1, ALP, and Runx‐2 was upregulated. Data are presented as mean ± SEM. *p < .05; **p < .01; ***p < .001. ALP, alkaline phosphatase; IGF, insulin‐like growth factor‐1; qRT‐PCR, quantitative real‐time polymerase chain reaction
