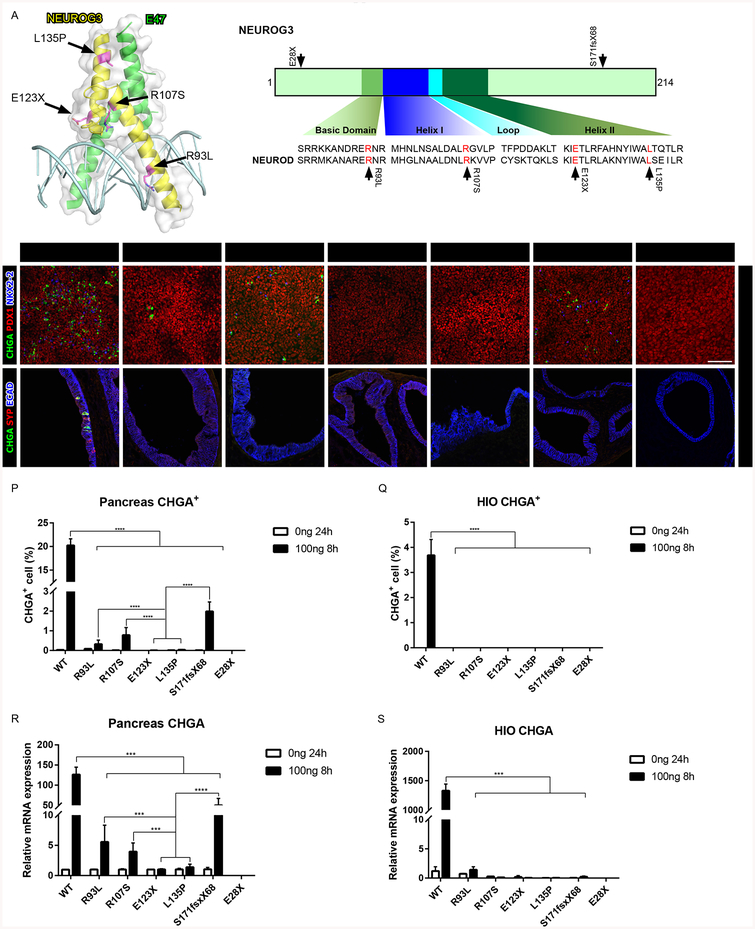
Figure 2:
Recapitulating NEUROG3 mutation phenotypes in hESC-derived pancreatic precursors and HIOs. (A) Schematic of NEUROG3, the NEUROG3-E47-DNA complex and the conserved basic helix-loop-helix region of NEUROG across the species. Mutations are indicated by the arrows.
(B-H) Immunofluorescence analysis of CHGA, PDX1 and NKX2–2 of pancreatic endocrine with 100ng 8-hour induction of NEUROG3 variants, 3 days post induction.
(I-O) Immunofluorescence analysis of CHGA, SYP and ECAD of 35-day-old HIOs with 100ng/ml 8-hour induction of NEUROG3 variants, 7 days post induction.
(P-Q) Quantification of CHGA+ endocrine cell percentage of pancreatic endocrine (P) and HIOs (Q) with 100ng/ml 8-hour induction of NEUROG3 variants.
(R-S) qPCR analysis of CHGA transcripts in pancreatic endocrine (R) and HIOs (S) with 100ng/ml 8-hour induction of NEUROG3 variants.
For all experiments, the data is representative of a minimum of 3 separate experiments. A minimum of 18 organoids were assessed. Scale bar = 100 μm. Data are represented as mean ± SD. *p ≤ 0.05, **p ≤ 0.01, ***p ≤ 0.001, and ****p ≤ 0.0001 for one-way ANOVA with Tukey HSD, Tuckey-Kramer (unequal sample size) or Dunnett T3 (unequal variance) post hoc test.

