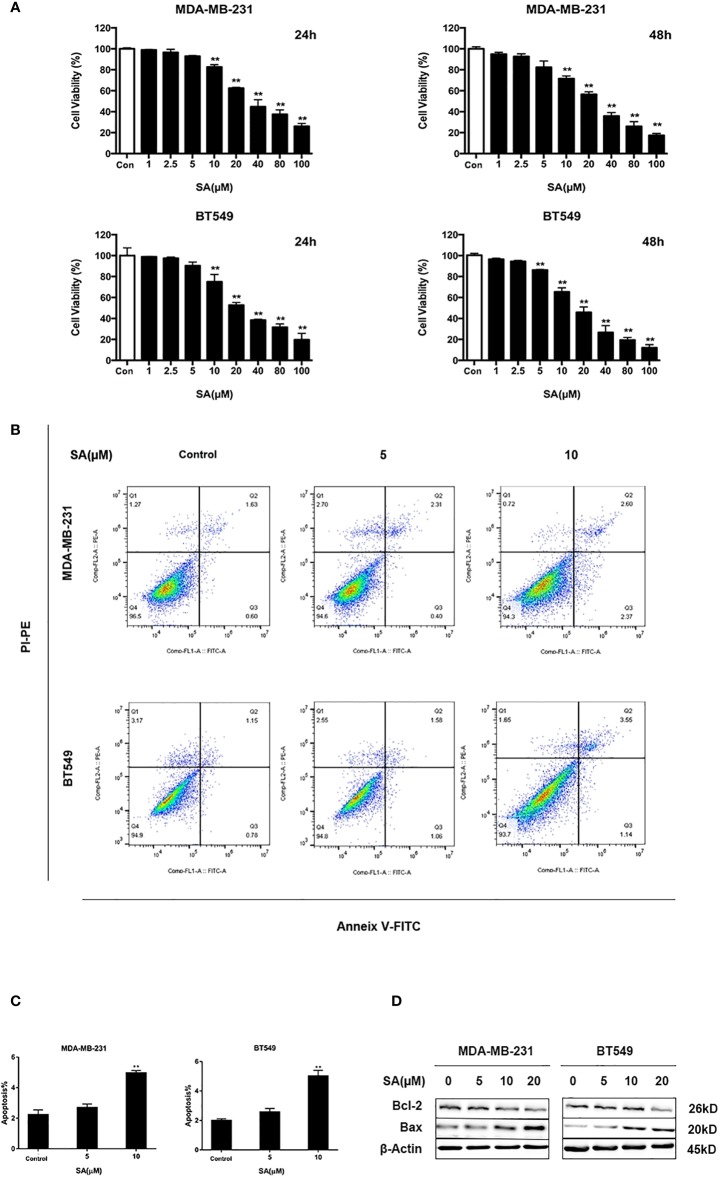
Figure 2.
SA inhibits TNBC cells proliferation. (A) Cell viability of MDA-MB-231 and BT549 cells after 24h and 48h SA treatment (Compared to the control group, ** p < 0.01). (B) Representative images of apoptosis in MDA-MB-231 and BT549 cells determined by Flow cytometry analysis after SA treatment. (C) Percentages of apoptotic cells in MDA-MB-231 and BT549 cells after SA treatment (Compared to the control group, ** p < 0.01). (D) Western blot analysis of Bax and Bcl-2 after SA treatment (Compared to the control group, ** p < 0.01).

