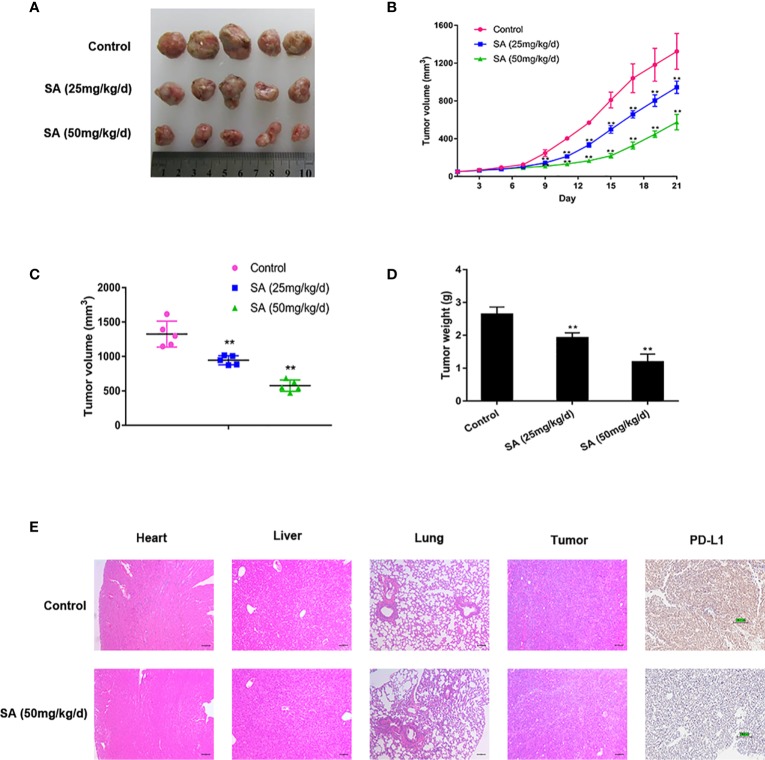
Figure 4.
SA inhibits TNBC tumor growth. (A)Tumor tissues collected at the end point. (B) Tumor volumes in xenograft models during the experiment and measured every three days (Compared to the control group, ** p < 0.01). (C) Tumor volumes in xenograft models at the end point (Compared to the control group, ** p < 0.01). (D) Tumor weights in xenograft models at the end point (Compared to the control group, ** p < 0.01). (E) Representative images of HE staining of normal tissues and IHC analysis of PD-L1 after SA administration.

