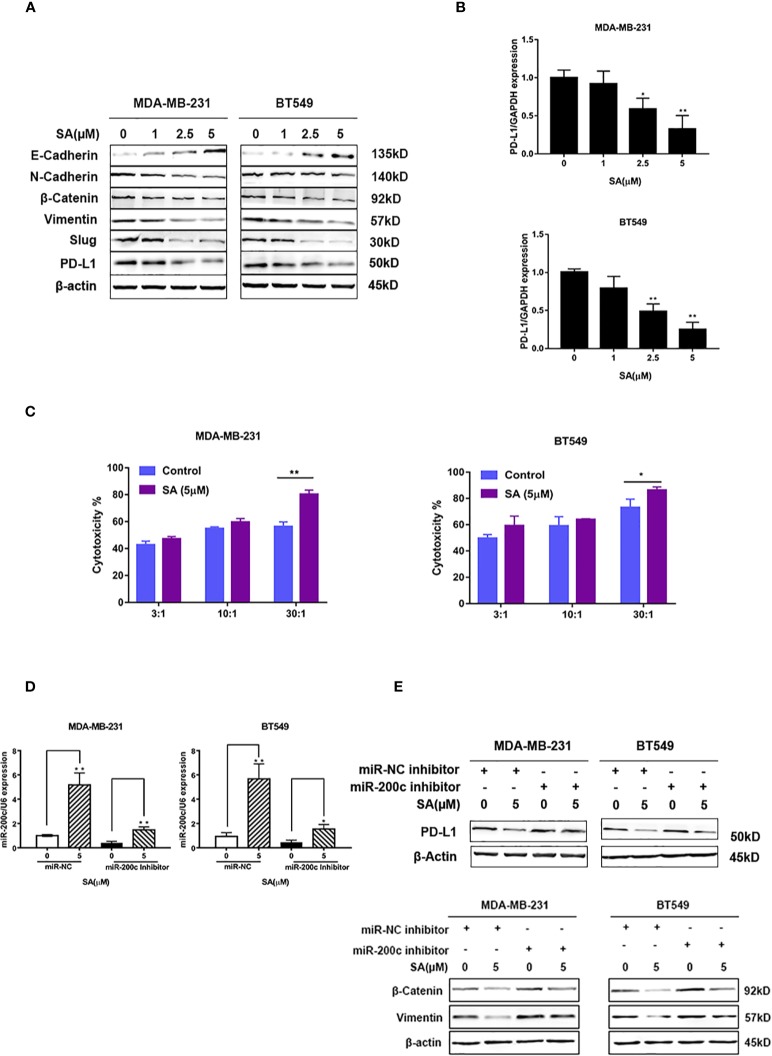
Figure 7.
SA inhibits PD-L1 through the up-regulation of miR-200c. (A) Western blot analysis of EMT markers and PD-L1 after SA treatment. (B) Real-time PCR analysis of PD-L1 in MDA-MB-231 and BT549 cells after SA treatment (Compared to the control group, * p < 0.05,** p < 0.01). (C) LDH cytotoxicity of MDA-MB-231 and BT549 cells with or without SA treatment at different effector to target (E: T) ratios (Compared to the control group, * p < 0.05,** p < 0.01). (D) Real-time PCR analysis of miR-200c after SA treatment with miR-200c inhibitor interference. (E) Western blot analysis of PD-L1, vimentin, and β-catenin after SA treatment with miR-200c inhibitor interference.

