
Figure 3. BNBC activation of inflammatory cytokine response in THF cells is STING-dependent.
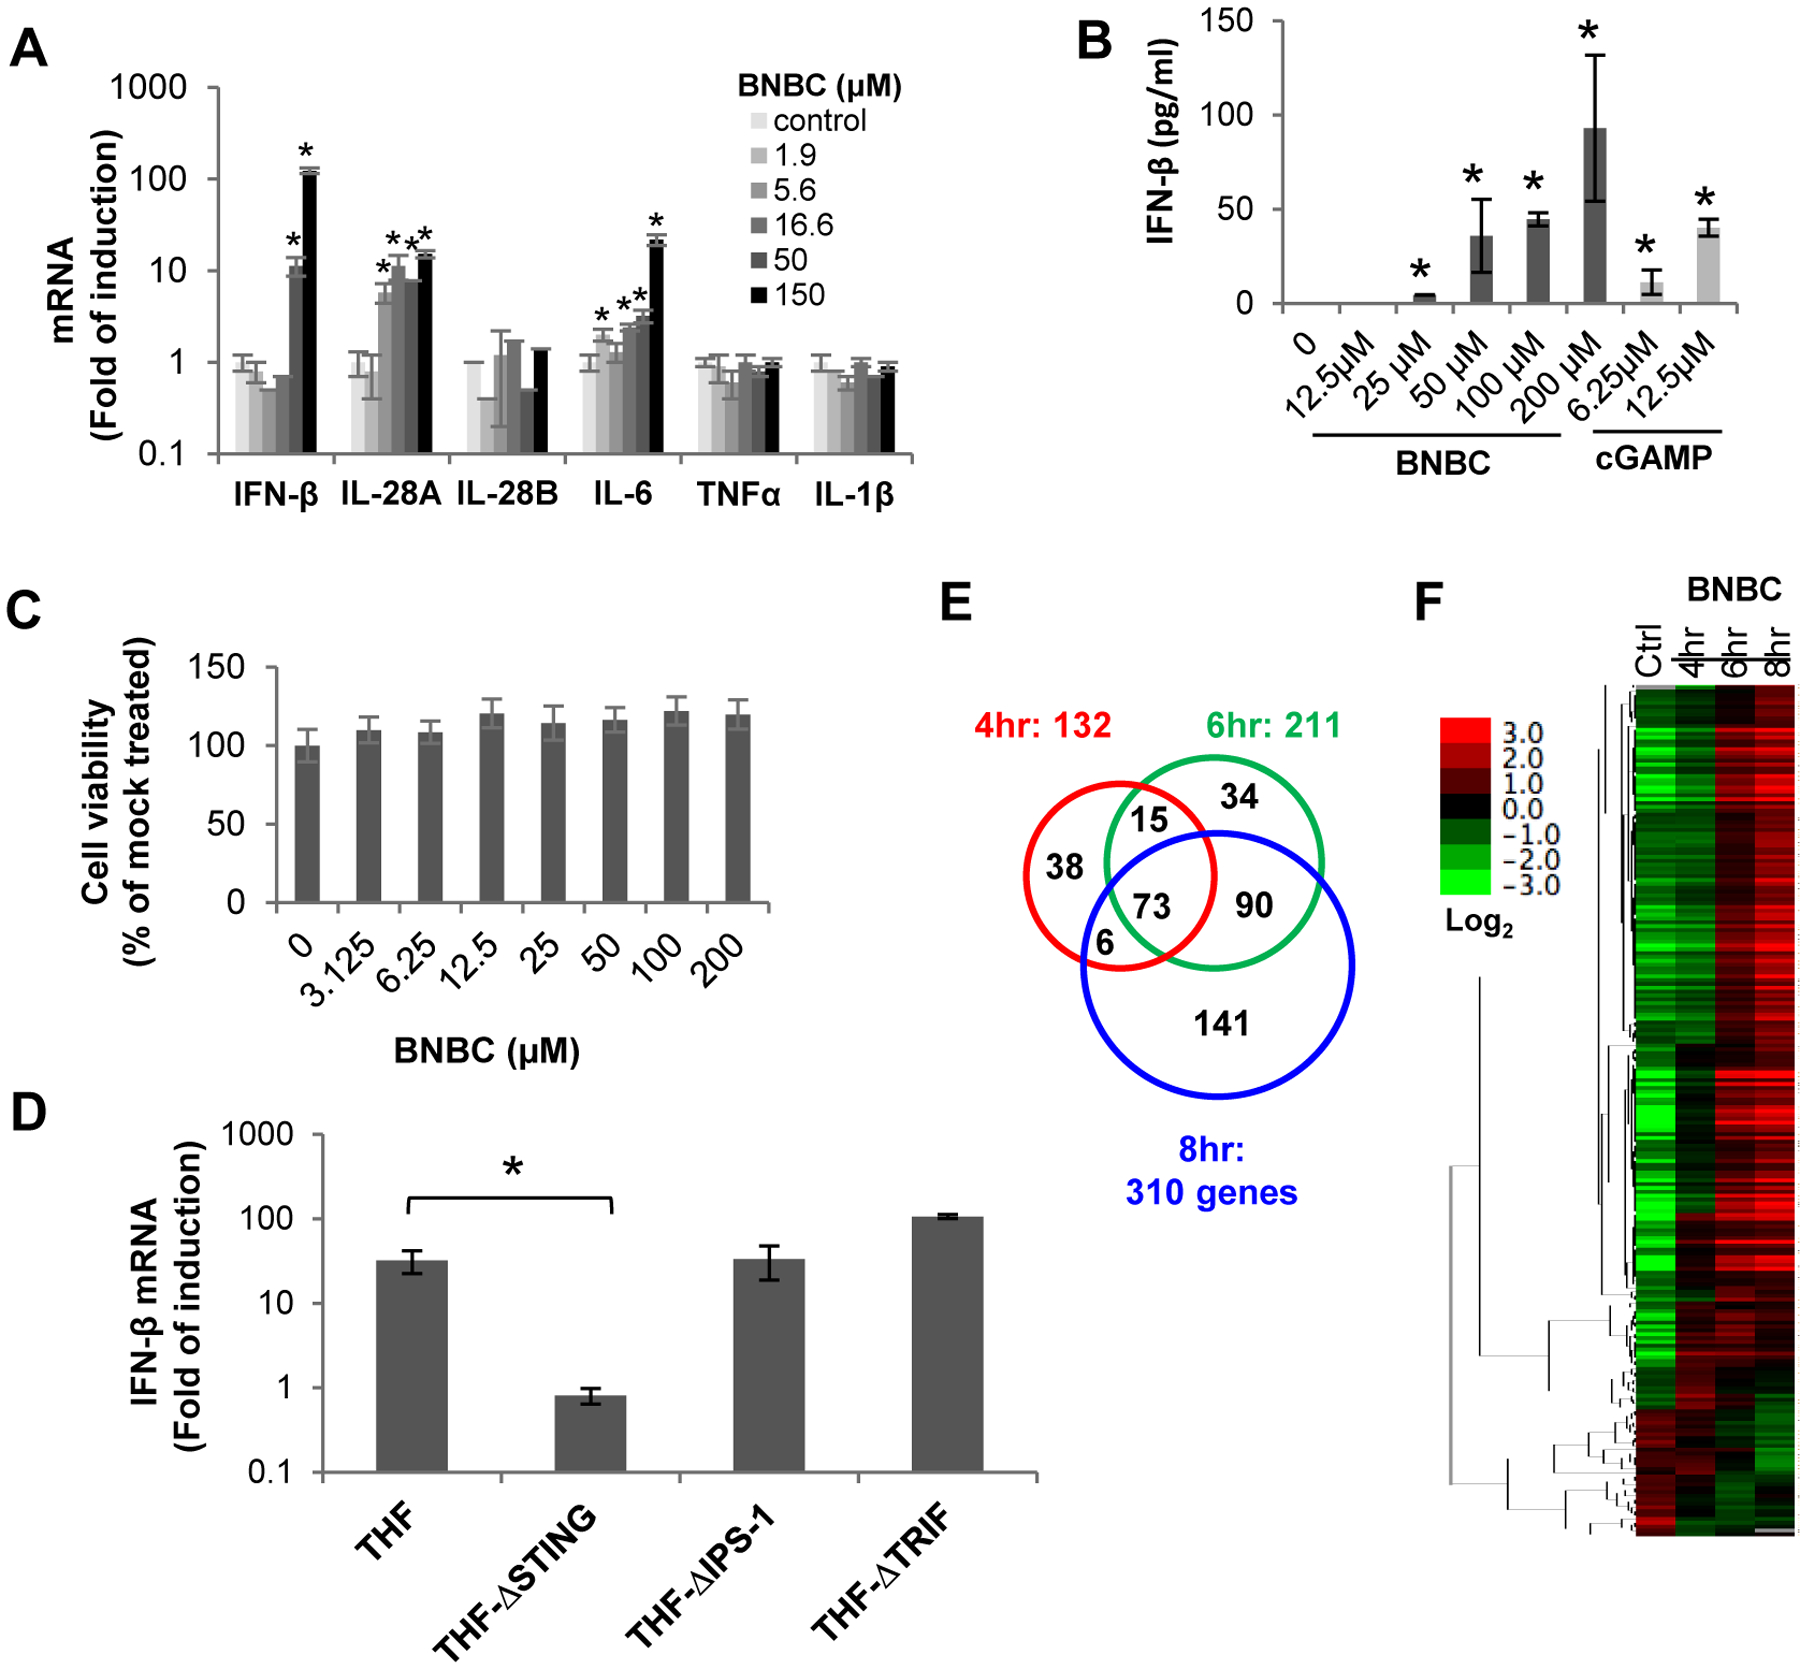
(A) THF cells were treated with indicated concentrations of BNBC for 6 h, followed by quantification of cytokine mRNAs by qRT-PCR assays. The levels of cytokine mRNA were expressed as fold of induction (mean ± standard deviation, n=4). (B) THF cells were treated with indicated concentrations of BNBC or cGAMP for 18 h, followed by detection of IFN-β in culture medium with ELISA assay (mean ± standard deviation, n=4). (C) Cytotoxicity was determined in THF cells and expressed as percent of mock treated control (mean ± standard deviation, n=3). (D) Parental THF cells as well as THF cells with knockout of STING, IPS-1 or TRIF were treated with 50 μM of BNBC for 6 h. IFN-β mRNA was detected by qRT-PCR and expressed as fold of induction (mean ± standard deviation, n=4). * indicates p<0.05 relative to mock treated control. (E and F) RNAseq analysis was performed using RNA samples extracted from THF cells treated with 50 μM of BNBC for indicated time periods. Venn diagram (E) illustration of numbers of up- or downregulated genes with fold change greater than 2 and FDR <20%, relative to mock treated control. The heat map (F) is expressed as the log2 fold difference.