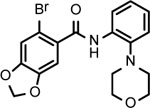
Table 2.
Structure-activity relationship study of BNBC
| Cmpd* | BNBC | 57093Z | 57057Z | 57071Z | 57076 | 59011Z | 59016Z |
|---|---|---|---|---|---|---|---|
| Structure |  |
 |
 |
 |
 |
 |
 |
|
1MinEC5X (μM) |
2.2 | 2.5 | > 200 | 2.6 | > 200 | > 200 | 50 |
| 1Maximum induction (fold) | 20.5 | 28.0 | - | 17.3 | - | - | 7.8 |
| 2CC50 (μM) | > 200 | > 200 | > 200 | > 200 | > 200 | > 200 | > 200 |
compound.
Luciferase activity was determined in HepG2/STING/ISG54Luc cells and expressed as Minimum Effective Concentration to induce 5-fold luciferase activity or maximum fold of luciferase induction.
Cytotoxicity was determined in HepG2/STING/ISG54Luc cells by MTT assay.
