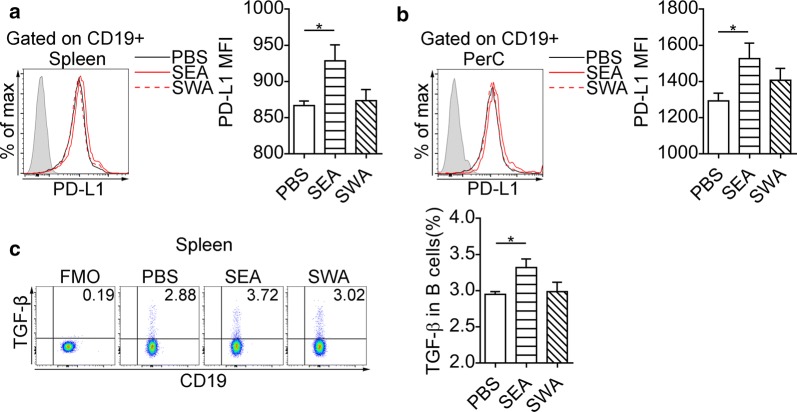
Fig. 5.
SEA induces expression of PD-L1 and TGF-β on B cells in vivo. Flow cytometry histograms represent cell surface expression of PD-L1 in splenic B cells (a) and PerC B cells (b), and significance levels from statistical analysis of PD-L1 MFI of splenic (a) and PerC B cells (b) are shown. The shaded histograms represent the FMO control. c Representative plots of TGF-β surface expression in CD19+ B cells and the percentages of TGF-β expressing B cells. The data are representative results of two independent experiments with at least 4 mice per group. *P < 0.05

