Fig. 8.
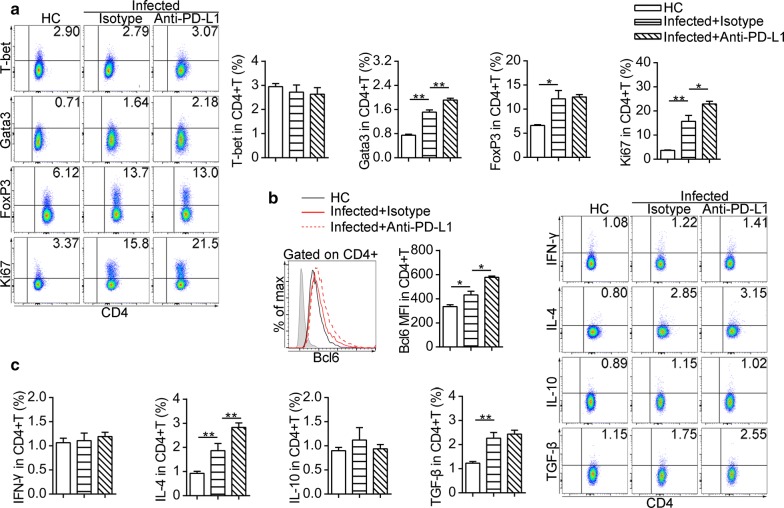
In vivo blocking of PD-L1 partially expands Th2 response after S. japonicum infection. a Flow cytometric dot plots represent expression of T-bet, Gata3, FoxP3 and Ki67 in splenic CD4+ T cells. b Flow cytometric histograms represent Bcl6 expression in splenic CD4+ T cells from uninfected mice (black line) and infected mice treated with isotype antibody (red line) and infected mice treated with anti-PD-L1 antibody (dashed line). The shaded histograms represent the FMO control. c Flow cytometric dot plots showing expression of IFN-γ, IL-4, IL-10 and TGF-β in splenic CD4+ T cells. All bar graphs indicate results from one of two independent experiments with ≥ 5 mice in each group. Experiments were performed two times with n = 10–12 per group. *P < 0.05, **P < 0.01

