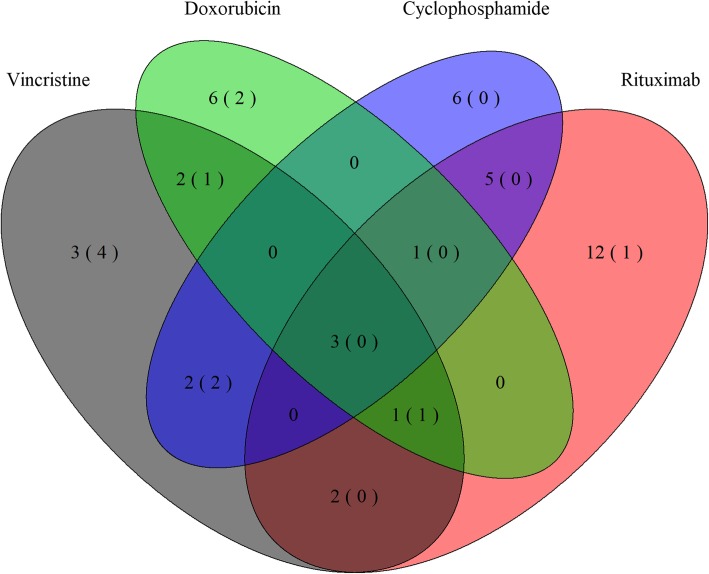
Fig. 1.
Drug response-specific miRNAs and HG-U133 probes. Venn-diagram depicting response specific differentially expressed miRNAs for rituximab, cyclophosphamide, doxorubicin, and vincristine. Numbers in parentheses show the number of matching HG-U133 Plus 2.0 probes. Figure was constructed using the R package VennDiagram v1.6.20

