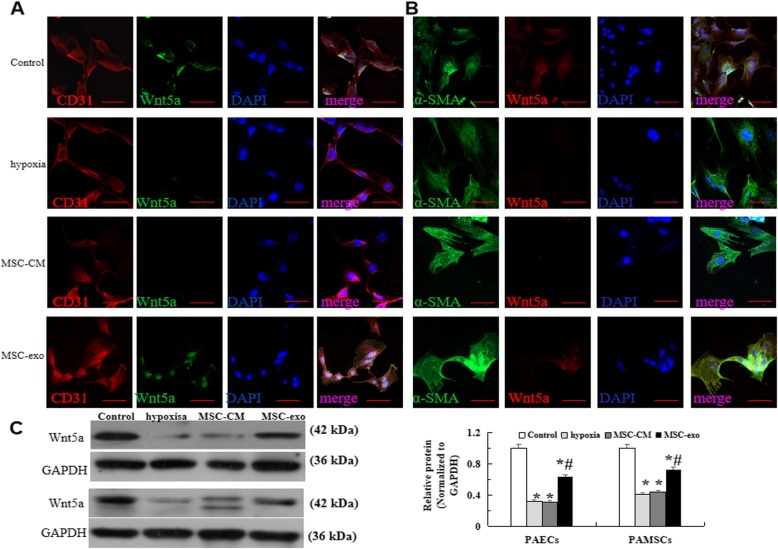
Fig. 4.
Wnt5a levels detecting in hypoxia induced PAECs and PAMSCs. a Immunofluorescence staining with CD31 (red), Wnt5a (green) and the cell nuclei were labelled with DAPI (blue) in the PAECs at a × 400 magnification. b Immunofluorescence staining with a-SMA (green), Wnt5a (red) and DAPI (blue) in PAMSCs at a × 400 magnification. c Protein expression and comparative analysis of of CD31 and a-SMA by Western blot. n = 3 times repeated; P < 0.05, one-way ANOVA followed by post hoc test; the data are present as mean ± SD; *hypoxia or *MSC-CM vs. control; #MSC-exo vs. hypoxia group. Scale bar = 100 μm

