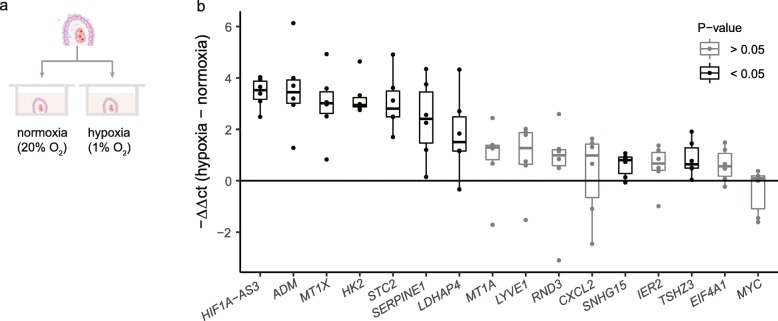
Fig. 2.
Hypoxia responses in human CP explants. a Schematic representation of the experimental setup of CP explants cultured in hypoxia and normoxia. b Difference in relative gene expression between human postmortem CP paired samples from each donor (n = 6) incubated 24 h in hypoxia (1% O2) or normoxia (20% O2), analyzed using RT-qPCR. Data are normalized to 18 s rRNA. Results are displayed as the negative difference in Ct values between hypoxia and normoxia (represented as -ΔΔCt) and presented as median with confidence interval. Differences were tested by paired two-tailed Welch t-test

