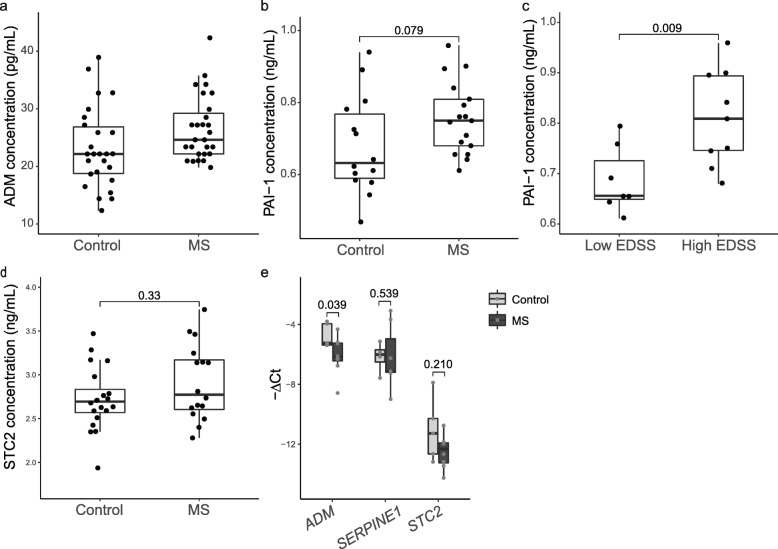
Fig. 3.
Altered concentration of ADM and PAI-1 peptides in the CSF of MS patients. a ADM protein concentration in CSF biopsies from MS patients (n = 27) and controls (n = 26), as measured by RIA. Differences were tested by two-tailed Wilcoxon rank sum test (Mann–Whitney U test) with continuity correction (p = 0.034). b PAI-1 protein concentration in CSF biopsies from MS patients (n = 17) and controls (n = 14), as measured by ELISA. Differences were tested by unpaired two-tailed classic t-test. c PAI-1 protein concentration in the CSF of MS patients with high disability (high EDSS; n = 9) or low disability (low EDSS; n = 7), as measured by ELISA. Differences were tested by unpaired two-tailed classic t-test. d STC2 protein concentration in CSF biopsies from MS patients (n = 16) and controls (n = 20), as measured by ELISA. Differences were tested by unpaired two-tailed classic t-test. In a-d results are displayed as median and interquartile ranges (IQR). eADM, SERPINE1 and STC2 mRNA expression in brain lesions of MS patients (n = 8) compared to white matter from controls (n = 5), as assessed by RT-qPCR. Data are normalised to GAPDH. Results are displayed as fold change relative to control white matter and presented as mean ± SEM. Differences were tested by two-tailed Welch t-test

