Fig. 2.
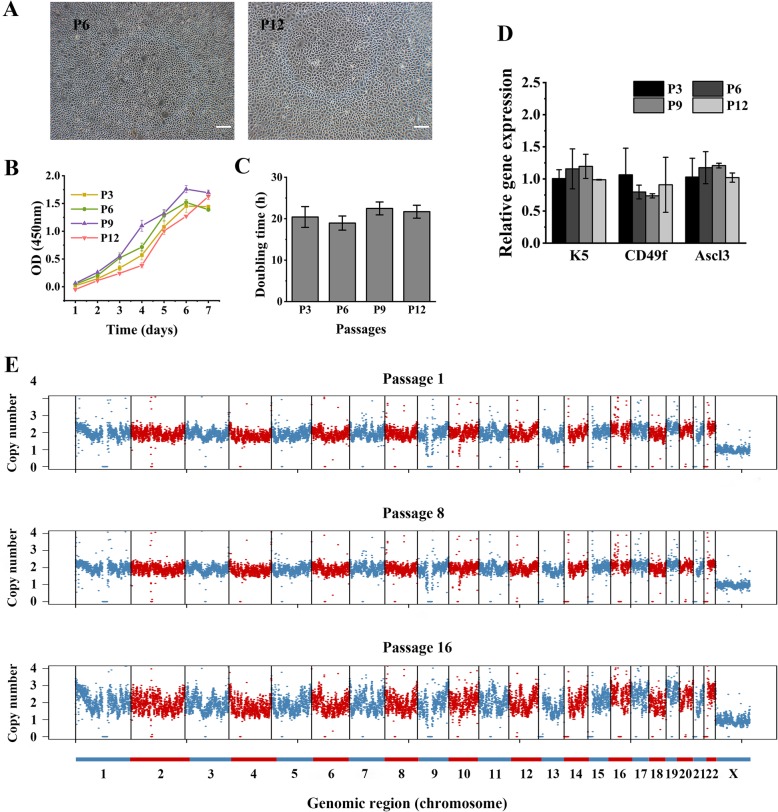
Long-term culture of hSMGepiS/PCs. a Images of long passaged hSMGepiS/PCs in 2D culture. Scale bar = 200 μm. b Growth curve and c doubling time of passaged hSMGepiS/PCs in 2D culture. Error bars, SD. Statistical analysis was performed using ANOVA, F = 1.266, P = 0.357, n = 3. d qRT-PCR showing that molecular markers of stem/progenitor cells were intact after long-term culture. Error bars, SD. ANOVA, F = 1.820 and P = 0.222 (K5), F = 1.183 and P = 0.383 (CD49f), F = 1.467 and P = 0.295 (Ascl3), n = 3. e Bulk DNA-seq results of hSMGepiS/PCs at passages 1, 8, and 16. Chromosomes are indicated by interlaced colors. Points are bins of 200 kb length

