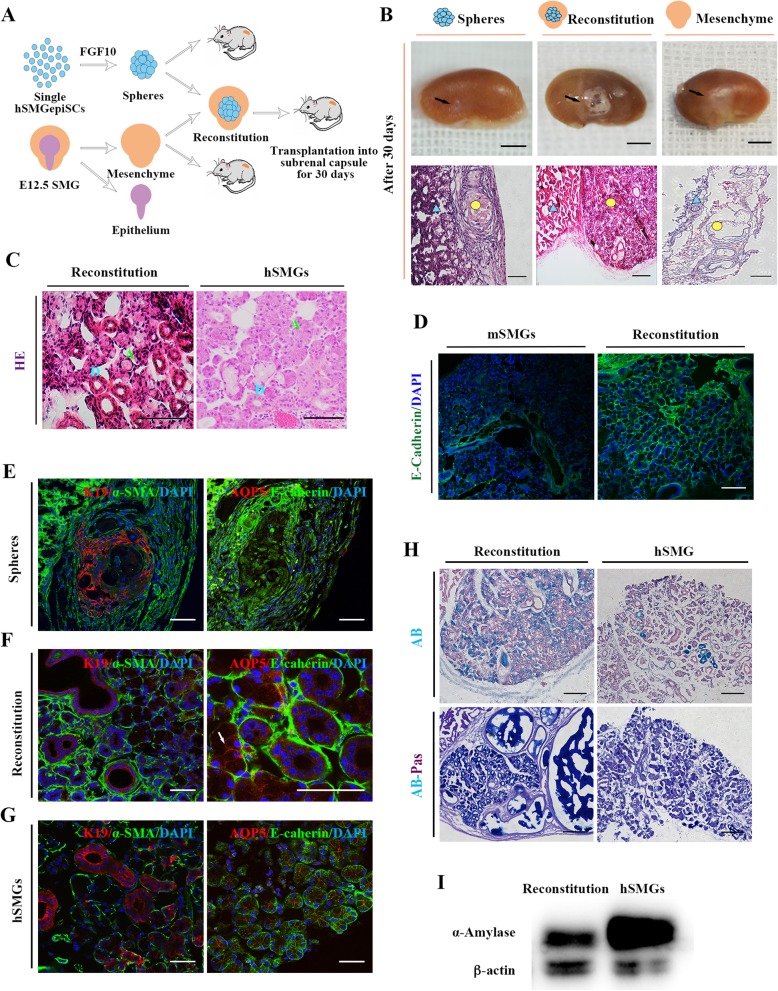
Fig. 4.
In vivo generation of salivary gland tissues from the hSMGepiS/PCs. a Schematic diagram of reconstitution and transplantation. b Representative photographs of mouse kidneys with renascent white tissue (black arrows) at day 30 after transplantation of hSMGepiS/PC spheres alone, E12.5 mesenchyme alone, and reconstitution of the above two tissues (top). Scale bar = 4 mm. Morphology of corresponding renascent tissue as visualized by HE staining (bottom). Blue triangle, kidney tissue; yellow circle, renascent tissue. Scale bar = 200 μm. c HE staining showing ductal and acinar structures in the reconstitution group (right) similar to natural human submandibular gland tissue (left). Blue D, ducts; green A, acini. Scale bar = 100 μm, n = 6. d Human-specific E-cadherin staining of a regenerated salivary gland in the reconstitution group (bottom). Mouse SMGs (mSMGs) were used as the negative control (top). Scale bar = 100 μm. e–g Immunofluorescence of the generated tissues in the hSMGepiS/PC spheres group (e) and the reconstitution group (f) for the salivary markers E-cadherin, AQP5 (write arrow), α-SMA, and K19, compared with human salivary glands (g). Scale bar = 50 μm. h AB-PAS staining showing comparable expression of glycoproteins in generated glands from the reconstitution group and hSMGs. Scale bar = 200 μm. i Western blot showing expression of amylase in the reconstitution-derived glands; hSMGs was used as the positive control

