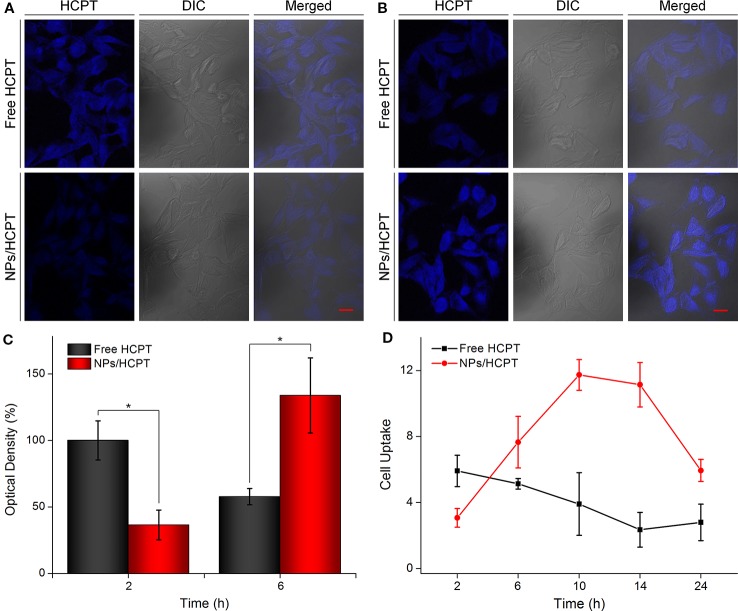
Figure 4.
Cell uptake and intracellular distribution of NPs/10-Hydroxycamptothecin (HCPT). (A) Confocal microscopy images of B16F10 cells after incubation with free HCPT or NPs/HCPT for 2 h (scale bar, 20 μm). (B) Confocal microscopy images of B16F10 cells after incubation with free HCPT or NPs/HCPT for 6 h (scale bar, 20 μm). (C) Quantitative analysis of optical density of HCPT fluorescence intensity after 2 h or 6 h of treatment with free HCPT or NPs/HCPT. (D) Cell uptake of B16F10 cells treated with free HCPT or NPs/HCPT at a HCPT concentration of 1.5 μg ml−1. Data are presented as mean ± SD (n = 3; *P < 0.05).

