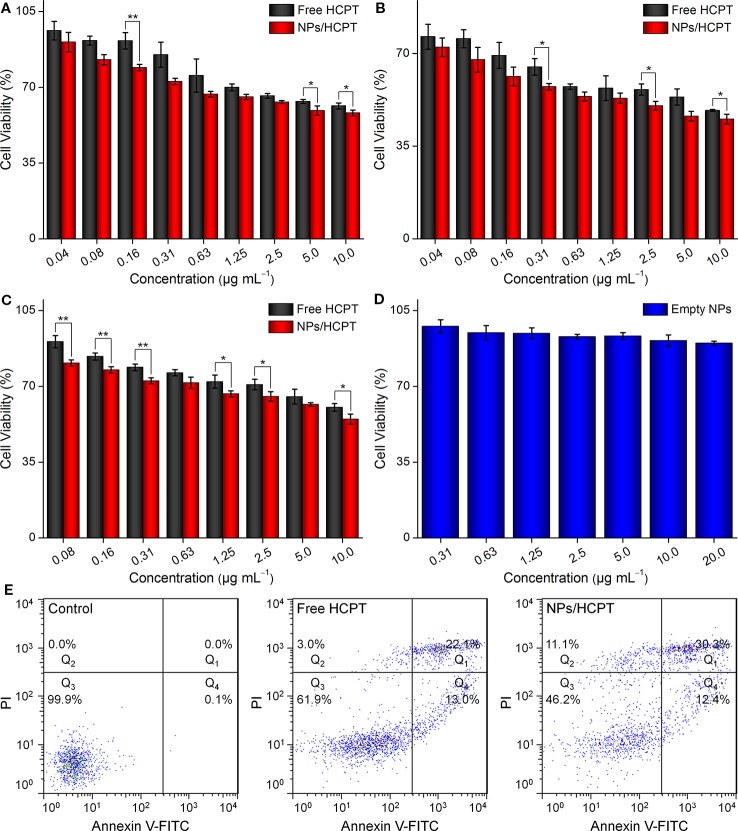
Figure 5.
Cell cytotoxicity. (A) Viabilities of B16F10 cells incubated with different concentrations of free 10-Hydroxycamptothecin (HCPT) or NPs/HCPT for 24 h. (B) Viabilities of B16F10 cells incubated with different concentrations of free HCPT or NPs/HCPT for 48 h. (C) Viabilities of B16F1 cells incubated with different concentrations of free HCPT or NPs/HCPT for 24 h. (D) Viabilities of B16F1 cells incubated with empty NPs for 24 h. (E) The percentage of apoptotic cells was analyzed by flow cytometry (FCM) with Annexin V-FITC and Propidium iodide (PI) staining after different treatments for 24 h. Data are presented as mean ± SD (n = 3; *P < 0.05, **P < 0.01).

