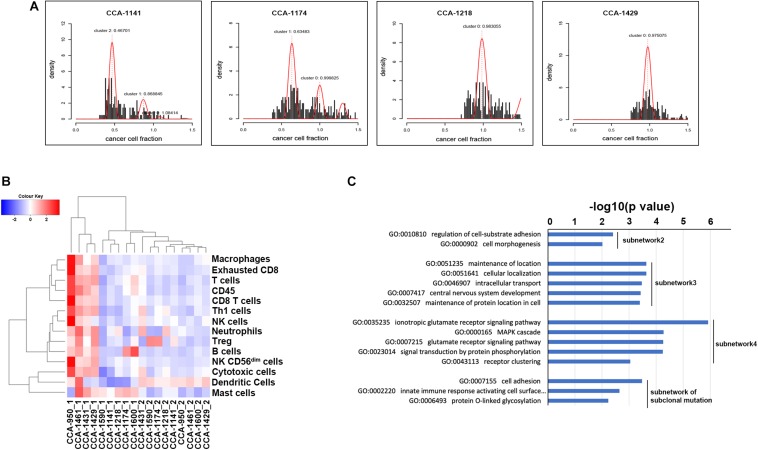
FIGURE 2.
Clonal evolution of CCA and its influence on biological interaction network. (A) Mutation clusters identified by Sclust in 4 of 9 included CCA patients. Additional cluster(s) other than cluster 0 were subclonal mutation clusters. Patient identifiers were provided above each plot. (B) Clustering of included tissue sample using known immune signatures. (C) Go term enrichment results in biological pathways for each identified subnetwork. Subnetwork 2–4 indicated subnetwork altered by clonal mutations and subnetwork of subclonal mutation indicated the subnetwork altered by subclonal mutations. Subnetwork 1 only contained two genes and did not show significant enrichment in Gene Ontology of biological pathways.

