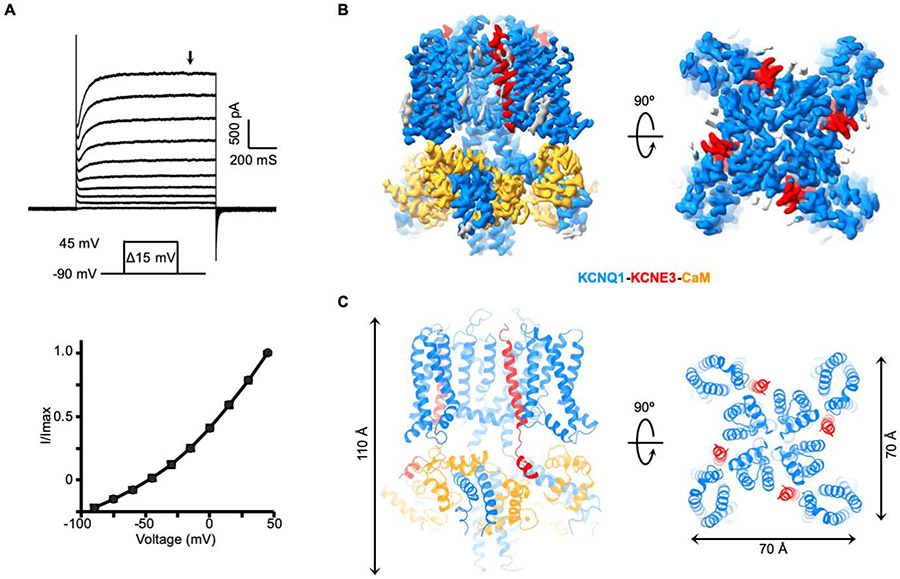
Figure 1. Function validation and structure determination of hKCNQ1EM-KCNE3-CaM complex.
(A) Voltage family current trace of the hKCNQ1EM-KCNE3-CaM complex recorded in CHO cells (top) and the I-V curve of the channel activation plotted at the time point indicated by the black arrow.
(B) Side and top view of the hKCNQ1EM-KCNE3-CaM cryo-EM density map. KCNQ1, KCNE3 and CaM are colored in blue, red and orange, respectively.
(C) Structure model of the hKCNQ1EM-KCNE3-CaM complex oriented and colored as in (B).

