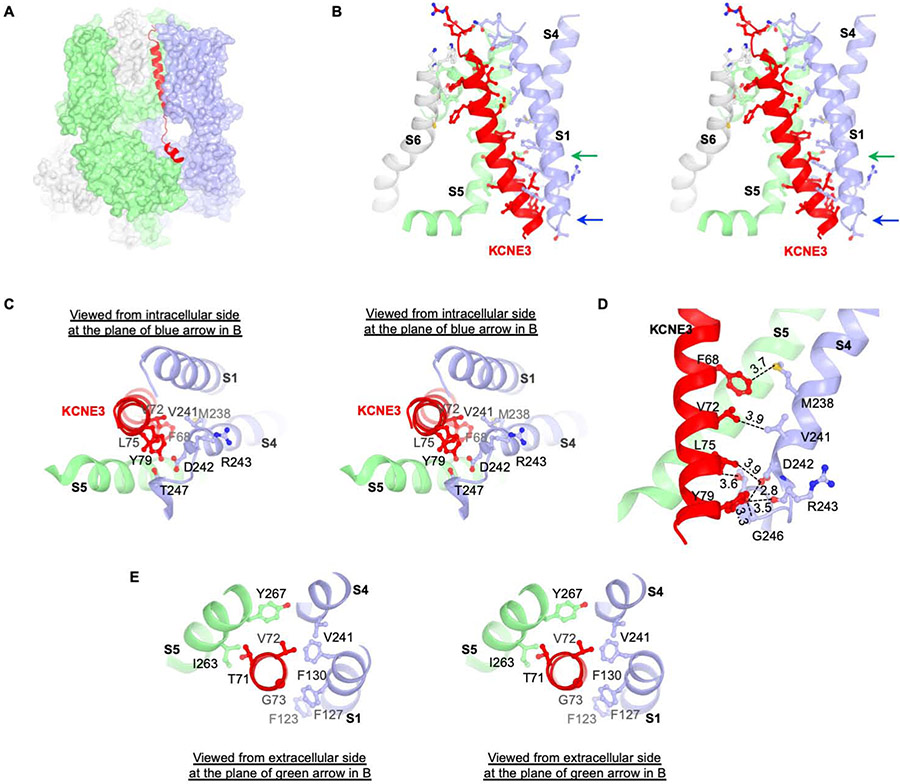
Figure 2. Interaction between KCNQ1-CaM and KCNE3.
(A) Interaction between KCNQ1 and KCNE3. KCNE3 is shown as ribbons and KCNQ1-CaM is shown as surface representation. KCNE3 interacts with three protomers of KCNQ1-CaM colored in green, light blue and grey, respectively. The same color code is used in panel (B), (C) and (D).
(B) Stereo view of the interaction between KCNQ1 and KCNE3 in the transmembrane region. Side chains of residues on the interface are shown as stick and balls.
(C) Stereo view from intracellular side of the KCNQ1 and KCNE3 interface at the plane indicated by blue arrow in (B).
(D) Interactions between S4 of KCNQ1 and transmembrane helix of KCNE3. The distances between potential interaction residues (within 4 Å) are labeled. Main chain of R243 is shown in order to demonstrate the potential interaction between Y79 and main chain of R243.
(E) Stereo view from extracellular side of the TVG region and its binding site in KCNQ1 at the plane indicated by green arrow in (B).

