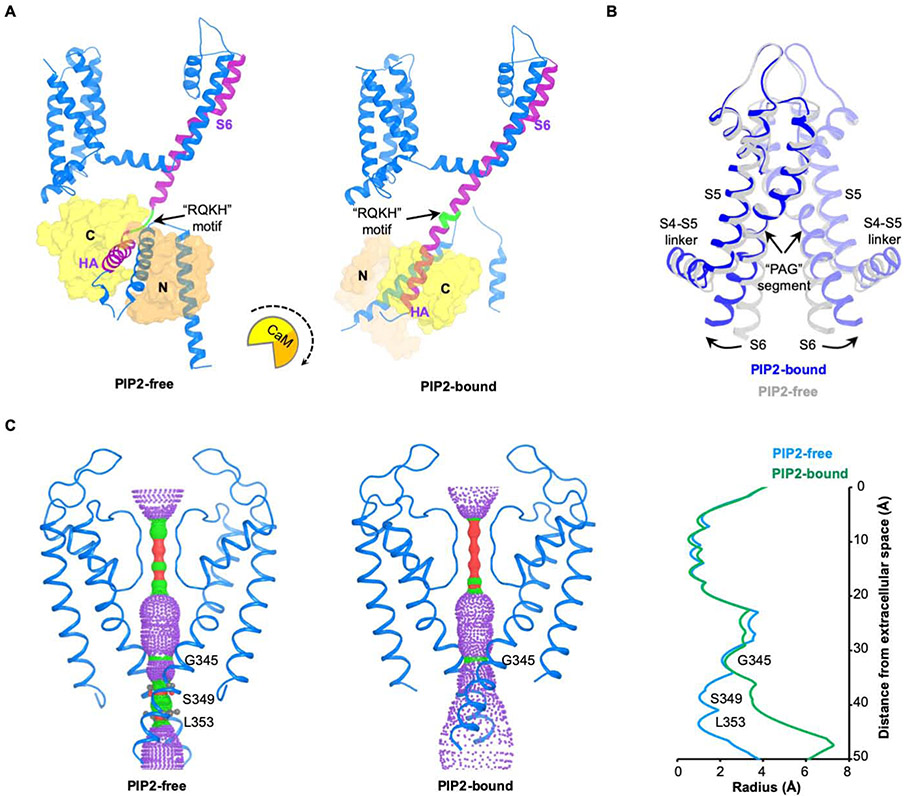
Figure 5. Conformational changes induced by PIP2.
(A) Conformational change of the channel complex in one KCNQ1-CaM protomer. The “RQKH” motif that undergoes structural rearrangement from a loop to a helix is colored in green. S6 and HA helixes of KCNQ1 are colored in purple. CaM is shown as surface with its N-lobe in orange and C-lobe in yellow. The rotational motion of CaM associated with the conformational change is indicated by a cartoon with a dash arrow.
(B) Overlay of the pore domains of PIP2-free and PIP2-bound structures showing the conformational change in the ion conducting pathway. The PIP2-free state is colored in grey and PIP2-bound state in blue. The S6 helix bends outward upon PIP2 binding at the point of PAG segment.
(C) Left: view of ion conducting pathways for PIP2-free and PIP2-bound states with front and back subunits excluded for clarity. Right: radius of the pore calculated using HOLE program. The amino acids restricting the pore are labeled.

