Figure 1.
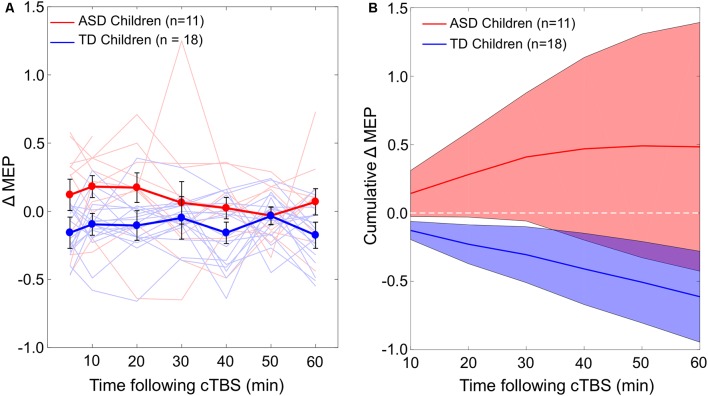
(A) Individual and grand-average change from baseline in MEP amplitude recorded from the right FDI muscle at 5–60 min following cTBS of the left motor cortex in ASD and TD groups. Error bars represent standard error of the mean. (B) Cumulative AUCs of the ΔMEPs and their 95% CI over T5–T10, T5–T20, …, and T5–T60 intervals for the two groups (the end time-point of each interval is labeled on the abscissa). The cumulative AUC measures were significantly more positive in the ASD group than in the TD group over all the T5–T10 to T5–T60 intervals (PFDR’s < 0.03). ASD, autism spectrum disorder; AUC, area-under-the-curve; CI, confidence interval; cTBS, continuous theta-burst stimulation; ΔMEP, natural log-transformed, baseline-corrected amplitude of motor evoked potentials; FDI, first dorsal interosseous; FDR, false discovery rate; MEP, motor evoked potential; TD, typically developing; Tm–Tn, over m to n minutes following cTBS.

