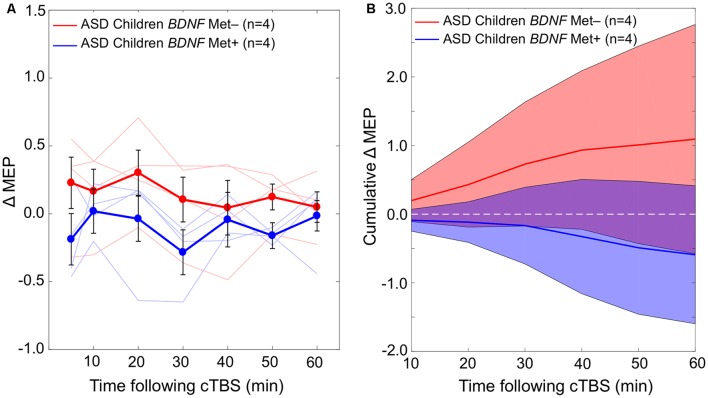
Figure 3.
(A) Changes in individual and grand-average MEPs recorded from the right FDI muscle at 5–60 min following cTBS of the left primary motor cortex in BDNF Met− (Val/Val) and Met+ (Val/Met) subgroups of participants with ASD. Error bars represent standard error of the mean. (B) Cumulative AUCs of the ΔMEPs and their 95% CI over T5–T10, T5–T20, …, and T5–T60 intervals for the two BDNF subgroups (the end time-point of each interval is labeled on the abscissa). The cumulative AUC measures were not significantly different between the two BDNF subgroups over any of the intervals (P-values > 0.18). ASD, autism spectrum disorder; AUC, area-under-the-curve; BDNF, brain-derived neurotrophic factor; CI, confidence interval; cTBS, continuous theta-burst stimulation; ΔMEP, natural log-transformed, baseline-corrected amplitude of motor evoked potentials; FDI, first dorsal interosseous; FDR, false discovery rate; MEP, motor evoked potential; Met, methionine; TD, typically developing; Tm–Tn, over m to n minutes following cTBS; Val, valine.

