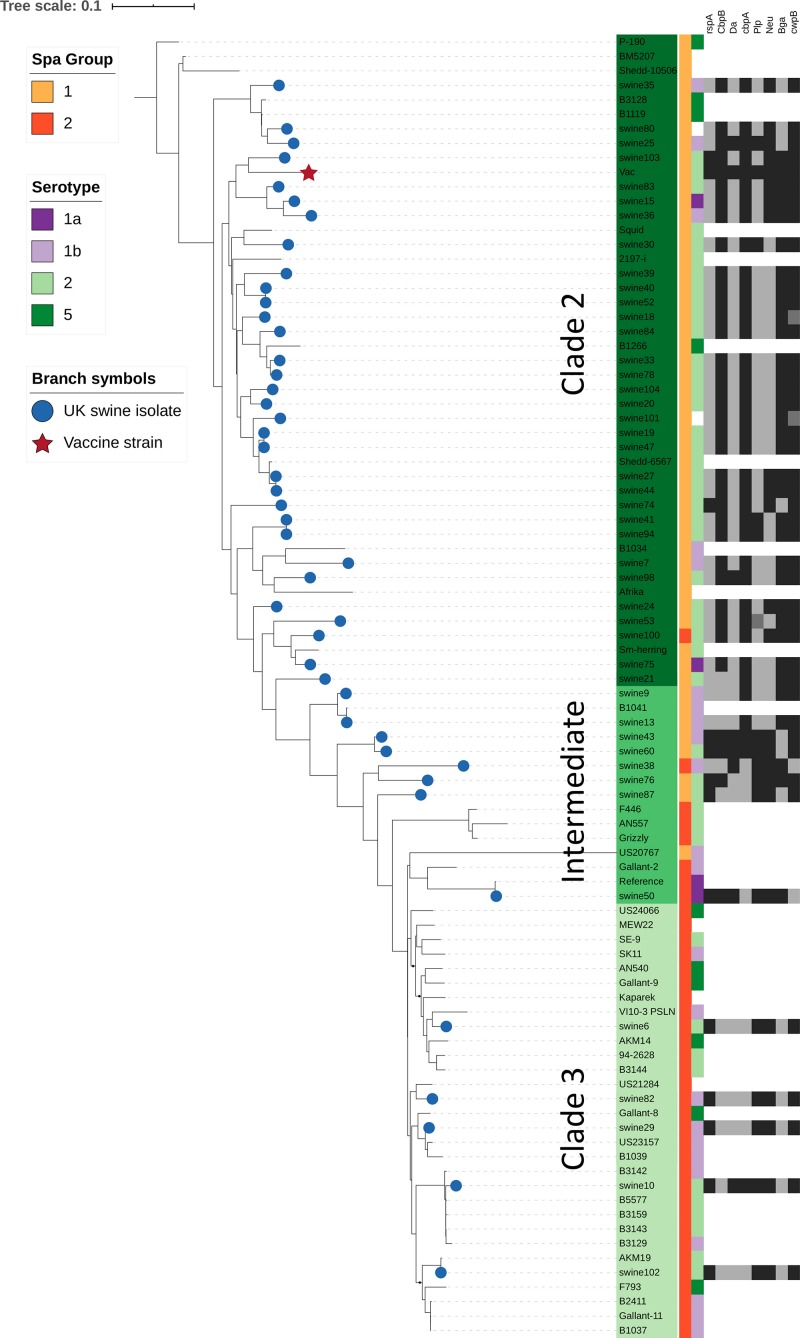
FIGURE 3.
Relationship of SpaA group, serotype, and immunogenic surface proteins to phylogenetic population structure. This phylogenetic tree is based on core single nucleotide polymorphisms (SNPs), and was estimated using the Nullarbor pipeline (same sequence data as in Figure 2). British pig isolates are represented by blue circles at branch tips, while the vaccine strain is represented by a red star. SpaA group (1 or 2) is shown by the yellow/orange color strip. Serotype (1a, 1b, 2, 5) as determined in silico is shown by the purple/green color strip. Those where phenotypic testing was not performed or where in silico test results differed are not shown. Variants of 8 different immunogenic surface proteins are shown by the black/gray color strips for all British pig isolates. Those shown in black are those which cluster most closely with the variant found in the vaccine strain; isolates in dark gray represent isolates with surface protein variants in outlier groups (Supplementary Table S1, Supplementary File S1).

