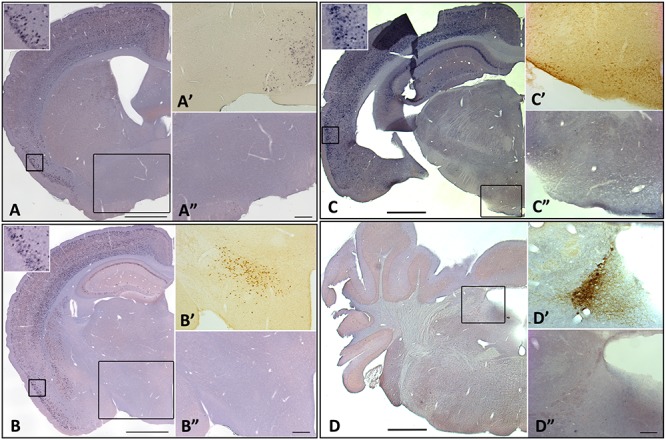
FIGURE 4.

Homer1a expression is not induced in canonical sleep/wake brain regions following sleep deprivation. Homer1a ISH shown as positive control in small inset for each section. Brain sections illustrating. (A) Ventrolateral preoptic nucleus, VLPO, (large inset); (A’) Galanin ISH as a marker for the VLPO; (A”) Homer1a in situ in VLPO; (B) lateral hypothalamus, LHA, (large box); (B’) Orexin immunostain as a marker for the LHA; (B”) Homer1a in situ in enlarged LHA; (C) Tuberomamillary nucleus, TMN, (large box); (C’) Histamine immunostain as a marker for the TMN; (C”) Homer1a in situ in enlarged TMN; (D) Locus coeruleus, LC, (large box); (D’) Tyrosine Hydroxylase immunostain as marker for the LC; (D”) Homer1a in situ in enlarged LC. Bar size A,B,C,D: 1 mm, A”,B”: 250 μm, C”,D”: 100 μm.
