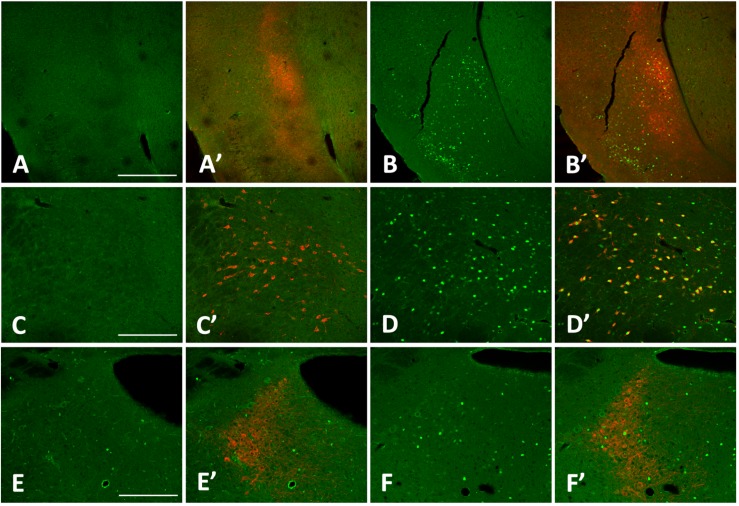
FIGURE 5.
cFos levels increase in the claustrum, lateral hypothalamus (LHA), and locus coeruleus (LC) with 3 h sleep deprivation (SD) compared to sleeping control (SC) animals. (A) 3 h SC cFos staining; (A’) 3 h sleep control with cFos and Latexin as marker for the claustrum; (B) 3 h SD cFos staining; (B’) 3 h SD with cFos and Latexin; (C) 3 h SC cFos staining; (C’) 3 h sleep control with cFos and Orexin as marker for the LHA; (D) 3 h SD cFos staining; (D’) 3 h SD with cFos and Orexin; (E) 3 h SC cFos staining; (E’) 3 h sleep control with cFos and tyrosine hydroxylase (TH) as marker for the LC; F) 3 h SD cFos staining; (F’) 3 h SD with cFos and TH. Bar size A: 500 μm; C,E: 250 μm.

