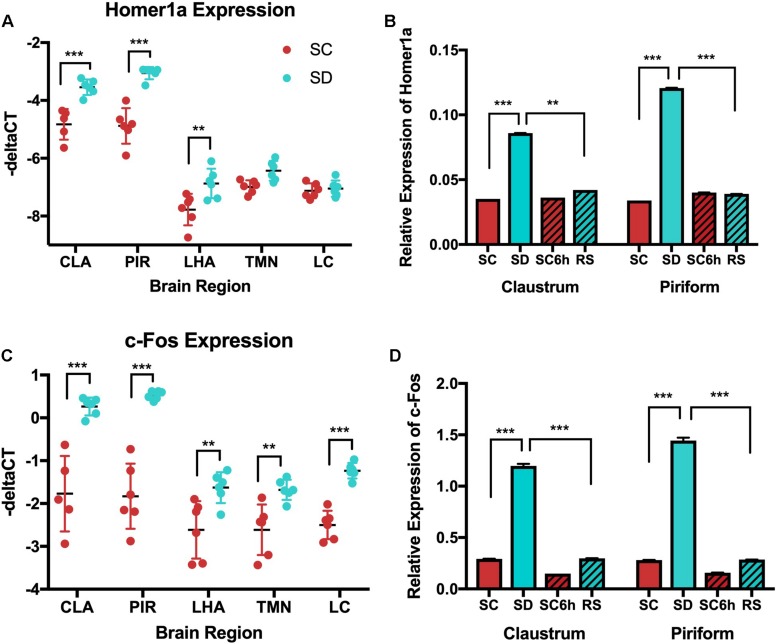
FIGURE 7.
QPCR shows increased homer1a expression in the claustrum (CLA) and piriform cortex (PIR) with sleep deprivation (SD) and c-fos increases in response to SD across all regions. (A) Homer1a qPCR across all brain regions in SC and SD conditions; (B) Homer1a qPCR across all behavioral conditions in claustrum and piriform. Homer1a expression is increased with SD in claustrum (p < 0.001) and piriform cortex (p < 0.0001) SC (sleep control); SD (sleep deprived); RS (recovery sleep); LHA (lateral hypothalamus);PIR (piriform cortex); CLA (claustrum); TMN (Tuberomammillary nucleus); LC (Locus coeruleus). C-fos is increased in response to SD in all regions and is reduced with recovery sleep in the claustrum and piriform. C) qPCR of c-Fos shows increased c-Fos in response to SD in all regions tested (p < 0.001); D) c-Fos qPCR across sleep deprivation (SD), 3 h sleep control (SC), 6 h diurnal sleep control (SC6h), and recovery sleep (RS) in young mice, (p < 0.001). See also Supplementary Figure S1 and Supplementary Tables S2–S4.

