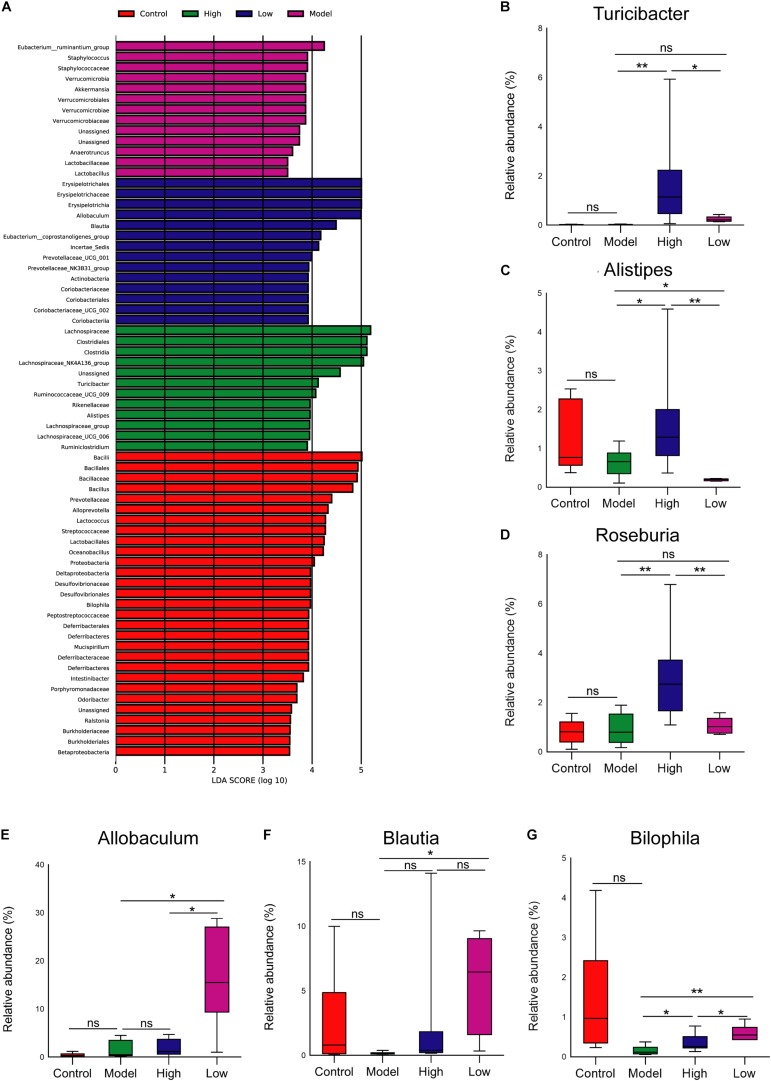
FIGURE 5.
(A) Gut microbiota comparisons among the four groups analyzed by LEfSe at different taxonomy levels, with taxa meeting LDA score threshold > 4 being listed. (B-F) The relative abundance of (B) Turicibacter, (C) Alistipes, (D) Roseburia, (E) Allobaculum, (F) Blautia, and (G) Bilophila at the genus level. ∗ p < 0.05, ∗∗ p < 0.01; ns, not significant.

