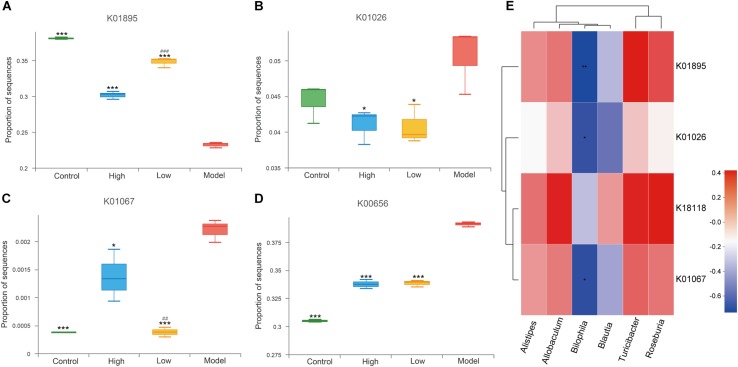
FIGURE 8.
(A–D) Differential enrichment of specific gut microbial KOs for SCFAs production among four groups. * p < 0.05, *** p < 0.001, vs Model. ### p < 0.001, High vs Low. (E) Spearman rank correlations between abundance of six biomarkers at genus level and SCFAs producing-related KOs. Red indicate being positive correlation and blue being negative.

