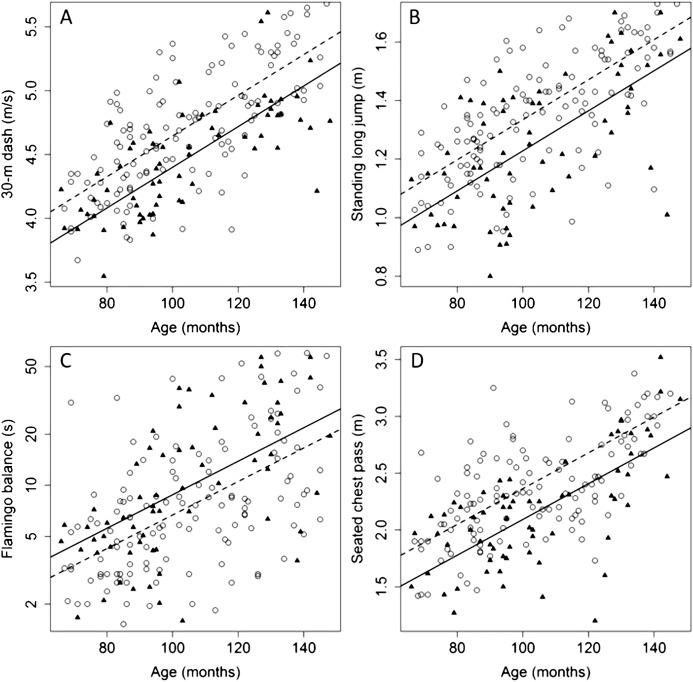
Figure 1. Relationships between age and average performance in four physical fitness tests (A–D) for female and male children aged 6–12.
Observed values are plotted using triangles and circles for male and female children, respectively. Solid and dashed lines display the predicted values of the linear regression models in the female and male group, respectively.

